Posts Tagged ‘HTML’

Ten years on: Jmol and WordPress.

Wednesday, May 16th, 2018

Ten years are a long time when it comes to (recent) technologies. The first post on this blog was on the topic of how to present chemistry with three intact dimensions. I had in mind molecular models, molecular isosurfaces and molecular vibrations (arguably a further dimension). Here I reflect on how ten years of progress in technology has required changes and the challenge of how any necessary changes might be kept “under the hood” of this blog.

That first post described how the Java-based applet Jmol could be used to present 3D models and animations. Gradually over this decade, use of the Java technology has become more challenging, largely in an effort to make Web-page security higher. Java was implemented into web browsers via something called Netscape Plugin Application Programming Interface  or NPAPI, dating from around 1995. NPAPI has now been withdrawn from pretty much all modern browsers. Modern replacements are based on JavaScript, and the standard tool for presenting molecular models, Jmol has been totally refactored into JSmol. Now the challenge becomes how to replace Jmol by JSmol, whilst retaining the original Jmol Java-based syntax (as described in the original post). Modern JSmol uses its own improved syntax, but fortunately one can use a syntax converter script Jmol2.js which interprets the old syntax for you. Well, almost all syntax, but not in fact the variation I had used throughout this blog, which took the form:

<img onclick=”jmolApplet([450,450],’load a-data-file;spin 3;’);” src=”static-image-file” width=”450″ /> Click for 3D structure

This design was originally intended to allow browsers which did not have the Java plugin installed to default to a static image, but that clicking on the image would allow browsers that did support Java to replace (in a new window) the static image with a 3D model generated from the contents of a-data-file. The Jmol2.js converter script had not been coded to detect such invocations. Fortunately Angel came to my rescue and wrote a 39 line Javascript file that does just that (my Javascript coding skills do not extend that far!). Thanks Angel!!

In fact I did have to make one unavoidable change, to;

<img onclick=”jmolApplet([450,450],’load a-data-file;spin 3;’,’c1′);” src=”image-file” width=”450″ /> Click for 3D structure

to correct an error present in the original. It manifests when one has more than one such model present in the same document, and this necessitates that each instance has a unique name/identifier (e.g. c1). So now, in the WordPress header for the theme used here (in fact the default theme), the following script requests are added to the top of each page, the third of which is the new script.

<script type=”text/javascript” src=”JSmol.min.js”></script>
<script type=”text/javascript” src=”js/Jmol2.js”></script>
<script type=”text/javascript” src=”JmolAppletNew.js”></script>

The result is e.g.

Click for 3D

Click for 3D structure of GAVFIS

Click for 3D

Click for 3D interaction

This solution unfortunately is also likely to be unstable over the longer term. As standards (and security) evolve, so invocations such as onclick= have become considered “bad practice” (and may even become unsupported). Even more complex procedures will have to be devised to keep up with the changes in web browser behaviour and so I may have to again rescue the 3D models in this blog at some stage! Once upon a time, the expected usable lifetime of e.g. a Scientific Journal (print!) was a very long period (>300 years). Since ~1998 when most journals went online, that lifetime has considerably shortened (or at least requires periodic, very expensive, maintenance). For more ambitious types of content such as the 3D models discussed here, it might be judged to be <10 years, perhaps much less before the maintenance becomes again necessary. Sigh!


At the time of writing, WaterFox is one of the few browsers to still support it. An early issue with using Javascript instead of Java was performance. For some tasks, the former was often 10-50 times slower. Improvements in both hardware and software have now largely eliminated this issue. Thus using Jquery.

Curating a nine year old journal FAIR data table.

Monday, May 29th, 2017

As the Internet and its Web-components age, so early pages start to decay as technology moves on. A few posts ago, I talked about the maintenance of a relatively simple page first hosted some 21 years ago. In my notes on the curation, I wrote the phrase “Less successful was the attempt to include buttons which could be used to annotate the structures with highlights. These buttons no longer work and will have to be entirely replaced in the future at some stage.” Well, that time has now come, for a rather more crucial page associated with a journal article published more recently in 2009.[1]

The story started a few days ago when I was contacted by the learned society publisher of that article, noting they were “just checking our updated HTML view and wanted to test some of our old exceptions“. I should perhaps explain what this refers to. The standard journal production procedures involve receiving a Word document from authors and turning that into XML markup for the internal production processes. For some years now, I have found such passive (i.e. printable only) Word content unsatisfactory for expressing what is now called FAIR (Findable, accessible, inter-operable and re-usable) data. Instead, I would create another XML expression (using HTML), which I described as Interactive Tables and then ask the publisher to host it and add that as a further link to the final published article. I have found that learned society publishers have not been unwilling to create an “exception” to their standard production workflows (the purely commercial publishers rather less so!). That exceptional link is http://www.rsc.org/suppdata/cp/b8/b810301a/Table/Table1.html but it has now “fallen foul of the java deprecation“. 

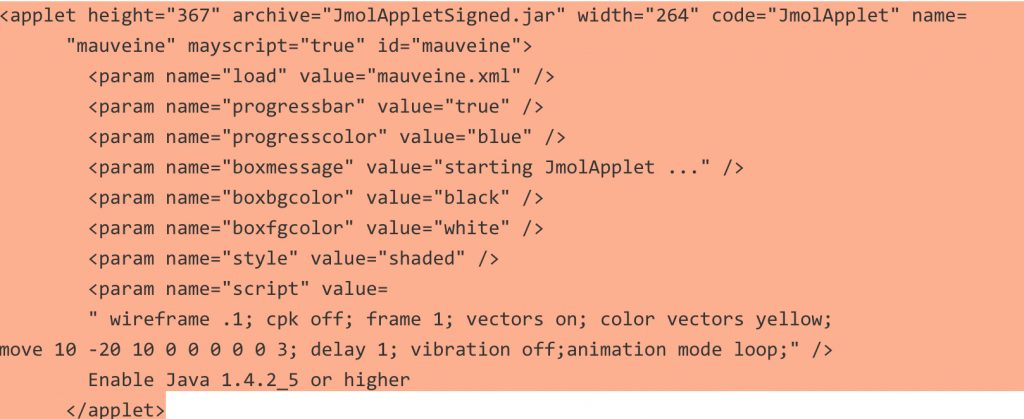
Back in 2008 when the table was first created, I used the Java-based Jmol program to add the interactive component. That page, when loaded, now responds with the message:

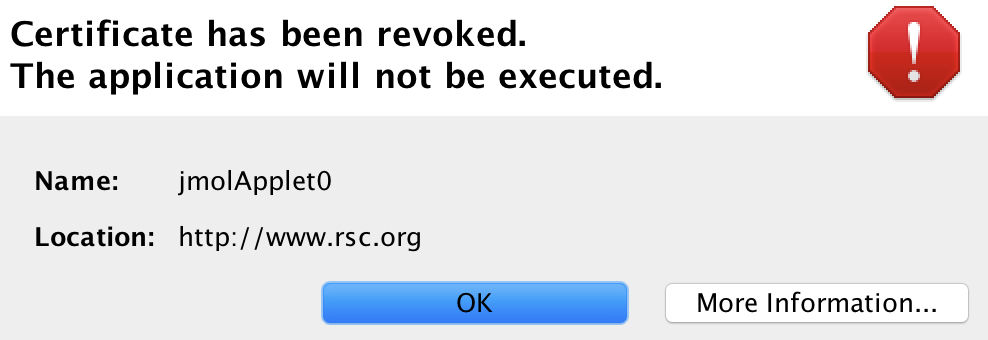
This I must emphasise is nothing to do with the publisher, it is the Jmol certificate that has been revoked. That of itself requires explanation. Java is a powerful language which needs to be “sandboxed” to ensure system safety. But commands can be created which can access local file stores and write files out there (including potentially dangerous ones). So it started to become the practise to sign the Java code with the developer certificate to ensure provenance for the code. These certificates are time-expired and around 2015 the time came to renew it. Normally, when such a certificate is renewed, the old one is allowed to continue operation. On this occasion the agency renewing the certificate did not do this but revoked the old one instead (Certificate has been revoked, reason: CESSATION_OF_OPERATION, revocation date: Thu Oct 15 23:11:18 BST 2015). So all instances of Jmol with the old certificate now give the above error message. 

The solution in this case is easy; the old Jmol code (as JmolAppletSigned.jar) is simply replaced with the new version for which the certificate is again valid. But simply doing that alone would merely have postponed the problem; Java is now indeed deprecated for many publishers, which is a warning that it will be prohibited at some stage in the future.‡ So time to bite the bullet and remove the dependency on Java-Jmol, replacing it with JSmol which uses only JavaScript.

Changing published content is in general not allowed; one instead must publish a corrigendum. But in this instance, it is not the content that needs changing but the style of its presentation (following the principle of the Web of a clear-cut separation of style and content). So I set out to update the style of presentation, but I was keen to document the procedures used. I did this by commenting out non-functional parts of the style components of my original HTML document (as <!– comment –>) and adding new ones. I describe the changes I made below.

  1. The old HTML contained the following initialisation code: jmolInitialize(".","JmolAppletSigned.jar");jmolSetLogLevel('0'); which was commented out.
  2. New scripts to initialize instead JSmol were added, such as:
    <script src="JSmol.min.js" type="text/javascript"> </script>
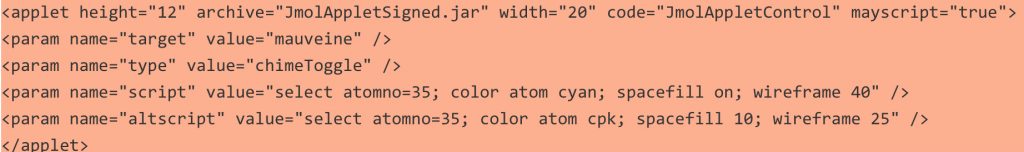
  3. I added further scripts to set up controls to add interactivity.
  4. The now deprecated buttons had been invoked using a Jmol instance:  jmolButton('load "7-c2-h-020.jvxl";isosurface "" opaque; zoom 120;',"rho(r) H")
  5. which was replaced by the JSmol equivalent, but this time to produce a hyperlink rather than a button (to allow the greek ρ to appear, which it could not on a button): <a href="javascript:show_jmol_window();Jmol.script(jmolApplet0,'load 7-c2-020.jvxl;isosurface &quot;&quot; translucent;spin 3;')">ρ(r)</a>,
  6. Some more changes were made to another component of the table, the links to the data repository. Originally, these quoted a form of persistent identifier known as a Handle; 10042/to-800. Since the data was deposited in 2008, the data repository has licensed further functionality to add DataCite DOIs to each entry. For this entry,  10.14469/ch/775. Why? Well, the original Handle registration had very little (chemically) useful registered metadata, whereas DataCite allows far richer content. So an extra column was added to the table to indicate these alternate identifiers for the data.
  7. We are now at the stage of preparing to replace the Java applet at the publishers site with the Javascript version, along with the amended HTML file. The above link, as I write this post, still invokes the old Java, but hopefully it will shortly change to function again as a fully interactive table.
  8. I should say that the whole process, including finding a solution and implementing it took 3-4 hours work, of which the major part was the analysis rather than its implementation.

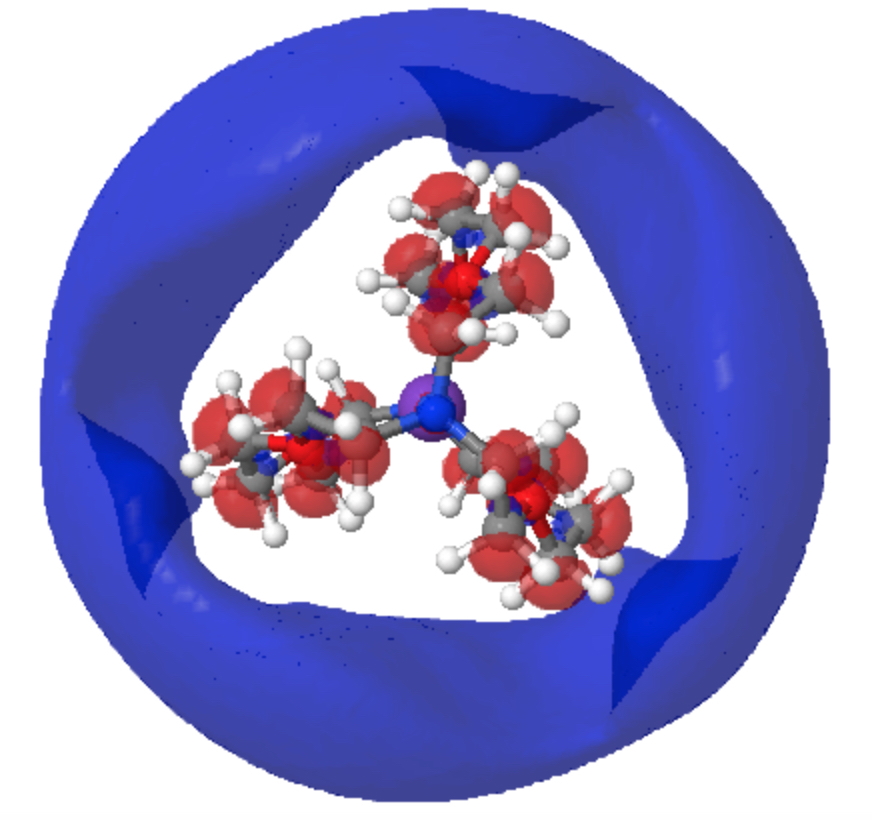
It might be interesting to speculate how long the curated table will last before it too needs further curation. There are some specifics in the files which might be a cause for worry, namely the so-called JVXL isosurfaces which are displayed. These are currently only supported by Jmol/JSmol. They were originally deployed because iso-surfaces tend to be quite large datafiles and JVXL used a remarkably efficient compression algorithm (“marching cubes”) which reduces their size ten-fold or more. Should JSmol itself become non-operational at some time in the (hopefully) far future (which we take to be ~10 years!) then a replacement for the display of JVXL will need to be found. But the chances are that the table itself will decay “gracefully”, with the HTML components likely to outlive most of the other features. The data repository quoted above has itself now been available for ~12 years and it too is expected to survive in some form for perhaps another 10. Beyond that period, no-one really knows what will still remain. 

You may well ask why the traditional journal model of using paper to print articles and which has survived some 350 years now, is being replaced by one which struggles to survive 10 years without expensive curation. Obviously, a 3D interactive display is not possible on paper. But one also hears that publishers are increasingly dropping printed versions entirely. One presumes that the XML content will be assiduously preserved, but re-working (transforming, as in XSLT) any particular flavour of XML into another publishers systems is also likely to be expensive. Perhaps in the future the preservation of 100% of all currently published journals will indeed become too expensive and we might see some of the less important ones vanishing for ever?


Nowadays it is necessary to configure your system or Web browser to allow even signed valid Java applets to operate. Thus in the Safari browser (which still allows Java to operate, other popular browsers such as Chrome and Firefox have recently removed this ability), one has to go to preferences/security/plugin-settings/Java, enter the URL of the site hosting the applet and set it to either “ask” (when a prompt will always appear asking if you want to accept the applet) or “on” when it will always do so. How much longer this option will remain in this browser is uncertain.

In the area of chemistry, an early pioneer was the Internet Journal of Chemistry, where the presentation of the content took full advantage of Web-technologies and was on-line only. It no longer operates and the articles it hosted are gone.

References

  1. H.S. Rzepa, "Wormholes in chemical space connecting torus knot and torus link π-electron density topologies", Phys. Chem. Chem. Phys., vol. 11, pp. 1340-1345, 2009. https://doi.org/10.1039/b810301a

Conference report: an example of collaborative open science (reaction IRCs).

Thursday, May 25th, 2017

It is a sign of the times that one travels to a conference well-connected. By which I mean email is on a constant drip-feed, with venue organisers ensuring each delegate receives their WiFi password even before their room key. So whilst I was at a conference espousing the benefits of open science, a nice example of open collaboration was initiated as a result of a received email.

Steven Kirk  contacted me with the following query: Do you know of any open-access database of calculated IRCs with coverage of as broad a range of classes of chemical reactions as possible? I recollected that about six years ago, I was exploring the use of iTunesU as a system for delivering course content in a rich-media format. I produced animations for about 115 reactions (many of which as it happens were taken from this blog, but quite a number were also unique to that project) and placed them into iTunesU, and now sending the URL https://itunes.apple.com/gb/course/id562191342 to Steven.

I should at this point explain something of the structure of such an iTunesU course.

  1. An essential feature is the course icon, seen below on the left. Since the course is hosted by Imperial College, it had to be an officially approved icon. I am sure you can believe me if I tell you that this took a month or so to obtain, with a fair bit of persistence required!
  2. I also had to get approval to place the iTunes app on all the teaching computers so that students could open the course. Believe me again when I tell you that I had to persuade the Apple lawyers in Cupertino to release a special license for this app to persuade our administrators here to install it on the Windows teaching clusters. Another few months had passed by.
  3. When creating an entry (using e.g. https://itunesu.itunes.apple.com/coursemanager/ ) one has to specify values for various descriptors, also often called metadata. Thus any one entry has fields for name and description, with the popularity added by Apple. Only a few words are visible in the description field, which can be expanded in iTunes using the i button.
  4. Steven meanwhile had replied asking if the original data that was used to generate the IRC might be available. Specifically his second question was “So the DOIs are only stamped into the animation’s bitmaps, or are they also somewhere in the metadata?“. That little i button is not easy to spot, and there is no indication, in the event, of what information it might actually contain.
  5. Here it is expanded. The contents are unstructured text, into which I have placed the required DOI.
  6. The lesson here is that I had fortunately had the foresight to include a link to the IRC data in anticipation of just such a question from someone in the future. But black mark to Apple here; the text cannot be selected and copied into a clipboard! It is fairly unFAIR data, since it can only be inter-operated (the I of FAIR) by a human re-typing it by hand. And the human has also to recognise the pattern of a DOI; a machine could not obtain this information easily. Moreover Steven is a Linux user; he does not readily have access to the iTunes app on this operating system!
  7. Also, there were 115 such entries, and now the prospect was rearing that each would have to be hand processed. Moreover, because the text was unstructured, there was no guarantee that I would have adopted the same pattern for all 115 entries.
  8. Fortunately Steven was on the ball. I quote again: it turns out iTunes isn’t needed at all. A service I found on the web http://picklemonkey.net/feedflipper-home/ takes an ITunes URL and converts it to an RSS feed. Opening this feed in Firefox and RSSOwl respectively let me save the feed as XML and HTML (both attached).
  9. This is currently where we stand (Steven’s first email was two days ago), but it’s not finished yet. Depending on how assiduous I was five years ago, some DOIs to the data may be acquired from the list. Sometimes I simply wrote e.g. See http://www.ch.imperial.ac.uk/rzepa/blog/?p=6816 knowing that the links to the data were there instead. I can already see that some descriptions have neither a DOI nor a link to the blog. More detective work will be needed, unfortunately.

How might the situation described above been avoided? Well, Apple in iTunesU only provided in effect one metadata field, and this was an unstructured one. Anything went in that field. Had they provided (or had the course creator been able to configure it themselves) there might have been another field entitled say “data source“. This could moreover been made a mandatory field and a structured one. Thus it might have only accepted known types of persistent identifier, such as a DOI. Further, the system could have checked that the DOI was actually resolvable. Before you ask, I did log a “bug” with Apple asking this be done, but nothing ever was. With such a tool to hand, I might have achieved data sources for all the 115 entries. The resulting XML (as generated above) could have been used to automate the retrieval of all 115 datasets describing this course. 

At this stage then, Steven can follow-up his interest in building a reaction IRC library and analysing it. I will do all I can to encourage Steven not to make the mistakes I did and to ensure that any further data that is required to augment the library does not suffer the problems above. On the other hand, I console myself that in two days, much of the data for the course I created five years ago was salvageable; I wonder how many other iTunesU courses there are for which that can be said!

I will let (with some blushing) the final word be Steven’s: You are one of the few chemists who has both pioneered and built the principles of ‘open chemistry’ into their actual scientific work. I visit your blog occasionally knowing that there is a very high probability I could download and tinker with the results of real calculations.


Might I assure all the speakers that I concentrated totally on their talks rather than incoming emails!

Revisiting (and maintaining) a twenty year old web page. Mauveine: The First Industrial Organic Fine-Chemical.

Thursday, February 2nd, 2017

Almost exactly 20 years ago, I started what can be regarded as the precursor to this blog. As part of a celebration of this anniversary, I revisited the page to see whether any of it had withstood the test of time. Here I recount what I discovered.

The site itself is at www.ch.ic.ac.uk/motm/perkin.html  and has the title “Mauveine: The First Industrial Organic Fine-Chemical” It was an application of an earlier experiment[1] to which we gave the title “Hyperactive Molecules and the World-Wide-Web Information System“. The term hyperactive was supposed to be a play on hyperlinking to the active 3D models of molecules built using their 3D coordinates. The word has another, more negative, association with food additives such as tartrazine – which can induce hyperactivity in children – and we soon discontinued the association. This page was cast as a story about a molecule local to me in two contexts; the first being that the discoverer of mauveine, W. H. Perkin, had been a student at what is now the chemistry department at Imperial College. The second was the realization that where we lived in west London was just down the road from Perkin’s manufacturing factory. Armed with (one of the first) digital cameras, a Kodak DC25, I took some pictures of the location and added them later to the web page. The page also included two sets of 3D coordinates for mauveine itself and alizarin, another dyestuff associated with the factory. These were “activated” using HTML to make use of the then very new Chime browser plugin; hence the term hyperactive molecule.

This first effort, written in December 1995, soon needed revision in several ways. I note that I had maintained the site in 1998, 2001, 2004 and 2006. This took the form of three postscripts to add further chemical context and more recent developments and in replacing the original Chime code for Java code to support the new Jmol software (Chime itself had been discontinued, probably around 2001 or possibly 2004). With the passage of a further ten years, I now noticed that the hyperactive molecules were no longer working; the original Jmol applet was no longer considered secure by modern browsers and hence deactivated. So I replaced this old code with the latest version (14.7.5 as JmolAppletSigned.jar) and this simple fix has restored the functionality. The coordinates themselves were invoked using the HTML applet tag, which amazingly still works (the applet tag had replaced an earlier one, which I think might have been embed?).  A modern invocation would be by using e.g. the JSmol Javascript based tool and so perhaps at some stage this code will indeed need further revision when the Java-based applet is permanently disabled.

You may also notice that the 3D coordinates are obtained from an XML document, where they are encoded using CML (chemical markup language[2]), which is another expression from the family that HTML itself comes from. That form may well last rather longer than earlier formats – still commonly used now – such as .pdb or .mol (for an MDL molfile). 

Less successful was the attempt to include buttons which could be used to annotate the structures with highlights. These buttons no longer work and will have to be entirely replaced in the future at some stage.

The final part of the maintenance (which I had probably also done with the earlier versions) was to re-validate the HTML code. Checking that a web page has valid HTML was always a behind-the-scenes activity which I remember doing when constructing the ECTOC conferences also back in 1995 and doing so probably does prolong the longevity of a web page. This requires “tools-of-the-trade” and I use now (and indeed did also back in 1995 or so) an industrial strength HTML editor called BBedit. To this is added an HTML validation tool, the installation of which is described at https://wiki.ch.ic.ac.uk/wiki/index.php?title=It:html5 I re-ran this again and so this 2017 version should be valid for a little while longer at least. The page itself now has not just a URL but a persistent version called a DOI (digital object identifier), which is 10.14469/hpc/2133[3]. In theory at least, even if the web server hosting the page itself becomes defunct, the page could – if moved – be found simply from its DOI. The present URL-based hyperlink of course is tied to the server and would not work if the server stopped serving.

To complete this revisitation, I can add here a recent result. Back in 1995, I had obtained the 3D coordinates of mauveine using molecular modelling software (MOPAC) together with a 2D structure drawing package (ChemDraw) because no crystal structure was available. Well, in 2015 such structures were finally published.[4] Twenty years on from the original “hyperactive” models, their crystal structures can be obtained from their assigned DOI, much in the same manner as is done for journal articles: Try DOI: 10.5517/CC1JLGK4[5] or DOI: 10.5517/CC1JLGL5[6].

At some stage, web archaeology might become a fashionable pursuit. Twenty year old Web pages are actually not that common and it would be of interest to chart their gradual decay as security becomes more important and standards evolve and mature. One might hope that at the age of 100, they could still be readable (or certainly rescuable). During this period, the technology used to display 3D models within a web page has certainly changed considerably and may well still do so in the future. Perhaps I will revisit this page in 2037 to see how things have changed!


The old code can still be seen at www.ch.ic.ac.uk/motm/perkin-old.html

It should really be postscript 4.

References

  1. O. Casher, G.K. Chandramohan, M.J. Hargreaves, C. Leach, P. Murray-Rust, H.S. Rzepa, R. Sayle, and B.J. Whitaker, "Hyperactive molecules and the World-Wide-Web information system", Journal of the Chemical Society, Perkin Transactions 2, pp. 7, 1995. https://doi.org/10.1039/p29950000007
  2. P. Murray-Rust, and H.S. Rzepa, "Chemical Markup, XML, and the Worldwide Web. 1. Basic Principles", Journal of Chemical Information and Computer Sciences, vol. 39, pp. 928-942, 1999. https://doi.org/10.1021/ci990052b
  3. H. Rzepa, "Molecule of the month: Mauveine.", Imperial College London, 2017. https://doi.org/10.14469/hpc/2133
  4. M.J. Plater, W.T.A. Harrison, and H.S. Rzepa, "Syntheses and Structures of Pseudo-Mauveine Picrate and 3-Phenylamino-5-(2-Methylphenyl)-7-Amino-8-Methylphenazinium Picrate Ethanol Mono-Solvate: The First Crystal Structures of a Mauveine Chromophore and a Synthetic Derivative", Journal of Chemical Research, vol. 39, pp. 711-718, 2015. https://doi.org/10.3184/174751915x14474318419130
  5. Plater, M. John., Harrison, William T. A.., and Rzepa, Henry S.., "CCDC 1417926: Experimental Crystal Structure Determination", 2016. https://doi.org/10.5517/cc1jlgk4
  6. Plater, M. John., Harrison, William T. A.., and Rzepa, Henry S.., "CCDC 1417927: Experimental Crystal Structure Determination", 2016. https://doi.org/10.5517/cc1jlgl5

500 chemical twists: a (chalk and cheese) comparison of the impacts of blog posts and journal articles.

Friday, June 3rd, 2016

The title might give it away; this is my 500th blog post, the first having come some seven years ago. Very little online activity nowadays is excluded from measurement and so it is no surprise that this blog and another of my “other” scholarly endeavours, viz publishing in traditional journals, attract such “metrics” or statistics. The h-index is a well-known but somewhat controversial measure of the impact of journal articles; here I thought I might instead take a look at three less familiar ones – one relating to blogging, one specific to journal publishing and one to research data.

First, an update on the accumulated outreach of this blog over this seven-year period. The total number of country domains measured is 190. The African continent still has quite a few areas with zero hits (as does Svalbard, with a population of only 2600 for a land mass area 61,000 km2 or 23 km2 per person). Given the low blog readership density on the African continent, it would be interesting to find out whether journal readership is any better.

Next, I look at the temporal distribution for individual posts. The first has attracted the highest total; in five years it has had 19,262 views (the diagram below shows the number of views per day). Four others exceed 10,000 and 80 exceed 1000 views.

Of these five, the next is the oldest, going back to 2009. I was very surprised to find such longevity, with the number of views increasing rather than decreasing with the passage of time.

So time now to compare these statistics with the journals. And of course its chalk and cheese. A “view” for a post means someone (or something) accessing the post URL, which is then recorded in the server log. Resolving the URL does at least load the entire content of the post; whether its read or not is of course not recorded. Importantly, if you want to view the content at some later stage, a new “view” has to be made (although some browsers do save a web page and allow offline viewing at a later stage, but I suspect this usage is low). With electronic journal access, it’s rather different. Access to an article is now predominantly via two mechanisms:

  1. From the table of contents (this is somewhat analogous to browsing a blog)
  2. From the article DOI.

Statistics for these two methods are gathered differently. The new CrossRef resource chronograph.labs.crossref.org (CrossRef allocate all journal DOIs) can be used to measure what they call DOI “resolutions”. A DOI resolution however leads one only to what is called the “landing page”, where the interested reader can view the title, the graphical abstract and some other metadata. It does not mean of course that they go on to actually view the article (as HTML, equivalent to the blog above, or probably more often by downloading a PDF file). Here are a few results using this method:

What about the other main journal article access method, not via a DOI but from a table of contents page journal page? A Google search revealed this site: jusp.mimas.ac.uk (JUSP stands for Journal usage statistics portal, which sounded promising). This site collects “COUNTER compliant usage data”. COUNTER (Counting Online Usage of Networked Electronic Resources) is an initiative supported by many journal publishers and it sounds an interesting way of measuring “usage” (as opposed to “views” or “resolutions”; it’s that chalk and cheese again!). I would love to be able to show you some statistics using this resource, but the “small print” caught me out: “JUSP gives librarians a simple way of analysing the value and impact of their electronic journals”. Put simply, I am a researcher, not a librarian. As a researcher I do not have direct access; JUSP is a closed, restricted access (albeit taxpayer-funded) resource. I am discussing this with our head of information resources (who is a librarian) and hope to report back here on the outcome.

Finally research data. This is almost too new to be able to measure, but this resource stats.datacite.org is starting to collect statistics on data resolutions (similar to DOI resolutions).

  1. You can see from the below for Imperial College (in fact this represents the two data repositories that we operate and which I cite here extensively on these blogs) that the resolution at running up to about 200 a month per dataset (more typically ~25 a month), with a total of 5065 resolutions for all items in March 2016 (the blog has ~12,000 views per month).

  2. Figshare is another data repository we have made use of:

So to the summary.

  1. Firstly, we see that I have shown three forms of impact, views, resolutions and usage. If one had statistics on all three, one might then try to see if they are correlated in any way. Even then, normalisation might be a challenge.
  2. Over ~7 years, five posts on this blog have attracted >10,000 views.
  3. Many of the blog posts have a long “finish” (to use a wine tasting term); the views continue regularly and often increase over time.
  4. My analysis of the three journal articles above (and about 15 others) shows that between 50-300 resolutions over a few years is fairly typical (for this researcher at least; I am sure most better known researchers attract far far more).
  5. The temporal distribution for article resolutions and blog views show both can have continuing impact over an extended period. None of the 18 articles I looked at show a significantly increasing impact with time but many of the blog posts do. This tends to suggest that the audiences for each are quite different; researchers for articles and a fair proportion of inquisitive students for the blog?
  6. I may speculate whether a correlation between my article resolutions and my h-index probably might be found, but the article resolution has a fine-grained temporal resolution (allowing a derivative wrt time to be obtained) that is perhaps potentially more valuable than just the coarse h-index integration (an article can of course be cited for both positive and negative reasons!).
  7. Initial analysis for data shows resolutions running at a similar rate to article resolutions. It is not yet possible to correlate data resolutions with article resolutions in which that data is discussed.

References

  1. S.M. Rappaport, and H.S. Rzepa, "Intrinsically Chiral Aromaticity. Rules Incorporating Linking Number, Twist, and Writhe for Higher-Twist Möbius Annulenes", Journal of the American Chemical Society, vol. 130, pp. 7613-7619, 2008. https://doi.org/10.1021/ja710438j
  2. A.E. Aliev, J.R.T. Arendorf, I. Pavlakos, R.B. Moreno, M.J. Porter, H.S. Rzepa, and W.B. Motherwell, "Surfing π Clouds for Noncovalent Interactions: Arenes versus Alkenes", Angewandte Chemie International Edition, vol. 54, pp. 551-555, 2014. https://doi.org/10.1002/anie.201409672
  3. K. Abersfelder, A.J.P. White, H.S. Rzepa, and D. Scheschkewitz, "A Tricyclic Aromatic Isomer of Hexasilabenzene", Science, vol. 327, pp. 564-566, 2010. https://doi.org/10.1126/science.1181771

How to stop (some) acetals hydrolysing.

Thursday, November 12th, 2015

Derek Lowe has a recent post entitled “Another Funny-Looking Structure Comes Through“. He cites a recent medchem article[1] in which the following acetal sub-structure appears in a promising drug candidate (blue component below). His point is that orally taken drugs have to survive acid (green below) encountered in the stomach, and acetals are famously sensitive to hydrolysis (red below). But if X=NH2, compound “G-5555” is apparently stable to acids.[1] So I pose the question here; why?

acetal

This reminded me of some work we did a few years ago on herbicides containing such an acetal substructure, where one diastereoisomer was very unstable to hydrolysis (and hence did not have the lifetime required of a herbicide) whereas the other diastereomer was far less labile and hence more suitable.[2],[3] Crystal structures (below) revealed that the two C-O bond lengths of the labile form were very unequal in length (Δ0.043Å), whereas the stable form had two equal C-O lengths (1.408Å, Δ=0.0Å).

Click for 3D

KAWYOW, Click for 3D

Click for 3D

KAWYEM, Click for 3D

A search of the Cambridge structure database (CSD) surprisingly reveals no hits for molecules containing the (blue) substructure in which X=NH2, but there is one example[4],[5] of an orthoformate in which the group equivalent to X is protonated as Me2NH+. For this example, all three C-O lengths are shorter than even the hydrolytically stable herbicide above (1.405, 1.402, 1.396Å). The distribution for 6-ring acetals in general shows hot-spots at ~1.415Å and 1.43Å (but sadly it is not possible to e.g. use this database to correlate these lengths with the aqueous stability of the entries).

OCO

Is this tentative further evidence that a group X = NH2 positioned as above in an acetal can inhibit its hydrolysis?

HUZKEZ, click for 3D

HUZKEZ, click for 3D

Time for calculations. A model (X=R=H) for the hydrolysis was constructed as above in which proton transfer from an acid (ethanoic) is achieved via a cyclic 8-ring transition state and which includes a continuum solvent field as ωB97XD/6-311G(d,p)/SCRF=water and one explicit water in the proton relay. The IRC looks thus:

acetalH

This shows that the first event is protonation of an oxygen, closely followed by cleavage of the associated C-O bond, and ending with deprotonation of the erstwhile water molecule.

acetalha

The value of ΔG298 is 38.2 kcal/mol (38.4 in relative total energy). Although rather high for a facile thermal reaction (perhaps the 8-ring TS is a bit too strained; possibly adding a second active water molecule to form a 10-ring might lead to a lower barrier?), we are more interested in the effect upon this barrier of group X (Table below).

X ΔE ΔG DataDOI,TS DataDOI,IRC
H 38.4 38.2 [6] [7]
NH2,eq 39.8 38.8 [8] [9]
NH3.Cl,eq 45.1 43.1 [10] [11]
NH3.Cl,ax 42.6 41.5 [12] [13]
CF3,eq 41.9 40.1 [14] [15]
SF5,eq 43.6 42.4 [16] [17]

Introduction of X=NH3+.Cl into an (equatorial) position which is antiperiplanar to the C-O bonds of the acetal produces a modified IRC profile. The barrier measured at a point IRC = -10 is ~41 kcal/mol, which is noticeably higher than for X=H. In fact the final barrier is even higher, since the reactant goes on to form a hydrogen bond between the water molecule and the Cl, an extra stabilisation not present with X=H (and so not really appropriate to include in the comparison).

acetal-NH3Cl

acetalnh3cl-eqa

Placing the X=NH3+.Cl into an (axial) position which is not antiperiplanar to the C-O bonds shows a lower barrier compared to the equatorial isomer. This difference can also be illustrated by the NBO localised orbital energies of the two reactants. With X=NH3+.Cl axial, the lone pair on the oxygen being protonated by the acid has an energy of -0.464 au, whereas the equatorial equivalent is a “less reactive” -0.471 au (a difference in energy of 4.4 kcal/mol, which is VERY approximately related to the effects being discussed).

I conclude that the inhibition of acetal solvolysis is induced by the presence of an electron withdrawing group X, via antiperiplanar effects on the basicity of the acetal oxygen. In moderately low pH, X=NH2 is likely to be fully protonated; in this state, X=NH3+.Cl is an even better electron withdrawing group. The effect is also much stronger if X = equatorial. So one can predict here that if the alternate stereoisomer with X = axial were to be synthesised, it would hydrolyse more quickly. Other groups (X=F, CN etc) would probably show similar behaviour.


I have added two further entries, X=CF3 and X=SF5 in the table above, showing the latter to be more effective at inhibiting hydrolysis.

References

  1. C.O. Ndubaku, J.J. Crawford, J. Drobnick, I. Aliagas, D. Campbell, P. Dong, L.M. Dornan, S. Duron, J. Epler, L. Gazzard, C.E. Heise, K.P. Hoeflich, D. Jakubiak, H. La, W. Lee, B. Lin, J.P. Lyssikatos, J. Maksimoska, R. Marmorstein, L.J. Murray, T. O’Brien, A. Oh, S. Ramaswamy, W. Wang, X. Zhao, Y. Zhong, E. Blackwood, and J. Rudolph, "Design of Selective PAK1 Inhibitor G-5555: Improving Properties by Employing an Unorthodox Low-p<i>K</i><sub>a</sub> Polar Moiety", ACS Medicinal Chemistry Letters, vol. 6, pp. 1241-1246, 2015. https://doi.org/10.1021/acsmedchemlett.5b00398
  2. P. Camilleri, D. Munro, K. Weaver, D.J. Williams, H.S. Rzepa, and A.M.Z. Slawin, "Isoxazolinyldioxepins. Part 1. Structure–reactivity studies of the hydrolysis of oxazolinyldioxepin derivatives", J. Chem. Soc., Perkin Trans. 2, pp. 1265-1269, 1989. https://doi.org/10.1039/p29890001265
  3. P. Camilleri, D. Munro, K. Weaver, D.J. Williams, H.S. Rzepa, and A.M.Z. Slawin, "Isoxazolinyldioxepins. Part 1. Structure–reactivity studies of the hydrolysis of oxazolinyldioxepin derivatives", J. Chem. Soc., Perkin Trans. 2, pp. 1929-1933, 1989. https://doi.org/10.1039/p29890001929
  4. Beckmann, C.., Jones, P.G.., and Kirby, A.J.., "CCDC 209989: Experimental Crystal Structure Determination", 2003. https://doi.org/10.5517/cc71hvl
  5. C. Beckmann, P.G. Jones, and A.J. Kirby, "<i>N,N,N</i>′,<i>N</i>′-Tetramethylstreptamine 2,4,6-orthoformate hydrochloride", Acta Crystallographica Section E Structure Reports Online, vol. 59, pp. o566-o568, 2003. https://doi.org/10.1107/s1600536803006287
  6. H.S. Rzepa, "C 6 H 14 O 5", 2015. https://doi.org/10.14469/ch/191581
  7. H.S. Rzepa, "Gaussian Job Archive for C6H14O5", 2015. https://doi.org/10.6084/m9.figshare.1599751
  8. H.S. Rzepa, "C 6 H 15 N 1 O 5", 2015. https://doi.org/10.14469/ch/191582
  9. H.S. Rzepa, "C6H15NO5", 2015. https://doi.org/10.14469/ch/191586
  10. H.S. Rzepa, "C 6 H 16 Cl 1 N 1 O 5", 2015. https://doi.org/10.14469/ch/191584
  11. H.S. Rzepa, "C6H16ClNO5", 2015. https://doi.org/10.14469/ch/191588
  12. H.S. Rzepa, "C 6 H 16 Cl 1 N 1 O 5", 2015. https://doi.org/10.14469/ch/191590
  13. H.S. Rzepa, "Gaussian Job Archive for C6H16ClNO5", 2015. https://doi.org/10.6084/m9.figshare.1601891
  14. H.S. Rzepa, "C 7 H 13 F 3 O 5", 2015. https://doi.org/10.14469/ch/191592
  15. H.S. Rzepa, "Gaussian Job Archive for C7H13F3O5", 2015. https://doi.org/10.6084/m9.figshare.1603088
  16. H.S. Rzepa, "C 6 H 13 F 5 O 5 S 1", 2015. https://doi.org/10.14469/ch/191595
  17. H.S. Rzepa, "Gaussian Job Archive for C6H13F5O5S", 2015. https://doi.org/10.6084/m9.figshare.1603420

Deviations from tetrahedral four-coordinate carbon: a statistical exploration.

Sunday, September 6th, 2015

An article entitled “Four Decades of the Chemistry of Planar Hypercoordinate Compounds[1] was recently reviewed by Steve Bacharach on his blog, where you can also see comments. Given the recent crystallographic themes here, I thought I might try a search of the CSD (Cambridge structure database) to see whether anything interesting might emerge for tetracoordinate carbon.

The search definition is shown below using a  simple carbon with four ligands, the ligands themselves also being tetracoordinate carbon. The search is restricted to data collected below temperatures of 140K, as well as R-factor <5%, no errors and no disorder. Cyclic species are allowed and a statistically reasonable 2773 hits emerged from the search.

Scheme

Recollect that the idealised angle subtended at the centre is 109.47°. I show below three separate heat plots of the search results. Why three? The way the search software (Conquest) works is that one could define four C-C distances and six angles, and then plot any combination of one distance and one angle. I show just three combinations here, but could have included many more.

There appear to be four distinct clusters of values for this angle that emerge from the three plots shown below (the “bin size” is 100, and the frequency colour code indicates how many hits there are in each bin).

  1. The hotspot is unsurprisingly ~109° with a corresponding C-C distance of ~1.54Å.
  2. There may be two clusters at angles of ~60° (cyclopropane), with C-C values ranging from ~1.47 to ~1.55Å.
  3. A collection at ~90° (mostly cyclobutane?), with C-C values up to 1.6Å.
  4. A collection at ~140° (again small rings), now with much shorter C-C values of ~1.46Å. This reminds of the approximation that the hybridisation in e.g. cyclopropane is a combination of sp5 and sp3.

Scheme

Scheme

Scheme

Ideally, what one might want to plot would be sums of four angles; for a pure tetrahedral carbon the sum would always be 438° (4*109.47°) but for a pure planar carbon it could be as low as 360° (4*90°). One could then see how closely the distribution approaches to the latter and hence reveal whether there are any true planar tetracoordinate carbon species known. Although the Conquest software cannot analyse in such terms, a Python-based API has recently been released that should allow this to be done, although I should state that this requires a commercial license and it is not open access code. If we manage to get it working, I will report!


As a teaser I also include a plot of six-coordinate carbon, in which the ligands can be any non-metal. Note the clusters at angles of 60, ~112 and ~120-130°. It is worth pointing out that the definition of the connection between a carbon and a ligand as a “bond” becomes increasingly arbitrary as the coordination becomes “hyper”. Because crystallography does not measure electron densities in “bonds”, we know nothing of its topology in this region. It is therefore quite possible that the appearance of the heat plot below might be related just as much to whatever convention is being used in creating the entry in the CSD as it would be to a quantum analysis of the bonding.

Scheme

References

  1. L. Yang, E. Ganz, Z. Chen, Z. Wang, and P.V.R. Schleyer, "Four Decades of the Chemistry of Planar Hypercoordinate Compounds", Angewandte Chemie International Edition, vol. 54, pp. 9468-9501, 2015. https://doi.org/10.1002/anie.201410407

Blasts from the past. A personal Web presence: 1993-1996.

Saturday, November 1st, 2014

Egon Willighagen recently gave a presentation at the RSC entitled “The Web – what is the issue” where he laments how little uptake of web technologies as a “channel for communication of scientific knowledge and data” there is in chemistry after twenty years or more. It caused me to ponder what we were doing with the web twenty years ago. Our HTTP server started in August 1993, and to my knowledge very little content there has been deleted (it’s mostly now just hidden). So here are some ancient pages which whilst certainly not examples of how it should be done nowadays, give an interesting historical perspective. In truth, there is not much stuff that is older out there!

  1. This page was written in May 1994 as a journal article, although it did have to be then converted into a Word document to actually be submitted.[1] Because it introduced hyperlinks to a chemical audience, we wanted to illustrate these in the article itself! Hence permission was obtained from the RSC for an HTML version to be “self-archived” on our own servers where the hyperlinks were supposed to work (an early example of Open Access publishing!). I say supposed because quite a few of them have now “decayed”. We were aware of course that this might happen, but back in 1994, no-one knew how quickly this would happen. What is interesting is that the HTML itself (written by hand then) has survived pretty well! I will leave you to decide how much the message itself has decayed.
  2. This HTML actually predates the above; it was written around November 1993 and represented the very first lecture notes I converted into this form (on the topic of NMR spectroscopy). A noteworthy aspect is the scarce use of colour images. At the start of 1994, the bandwidth available on our campus was pretty limited (the switches were 10 Mbps only) and a request went out to reduce the bit-depth of any colour images to 4-bits to help conserve that bandwidth! I rather doubt anyone took much notice however, and the policy was forgotten just a few months later.
  3. In 1996, I had two visitors to the group, Guillaume Cottenceau, a french undergraduate student, and Darek Bogdal, a Polish researcher who wanted to learn some HTML. Together they produced this, which was an interactive tutorial to accompany the NMR lecture notes previously mentioned. These pages introduce the Java applet (yes, it was very new in 1996), which Guillaume had written and which Darek then made use of. And hey, what do you know, the applet still works (although you might have to coerce your browser into accepting an unsigned applet).
  4. Here is a programming course that I had been running with Bryan Levitt for a few years, now recast into HTML web pages some time in 1994-5. This particular project I still hold dear, since it expanded upon the NMR lectures by getting the students to synthesize a FID (free induction decay) using the program they wrote, and then perform a Fourier Transform on it. I even encouraged students to present their results in HTML (I cannot now remember how many did). This link is to the computing facilities we offered students in 1994 for this project, ah those were the times! In 1996, the programming course was replaced by one on chemical information technologies, and here students were most certainly expected to write HTML. Some of the best examples are still available. And to illustrate how things happen in cycles, that course itself is now gone to be replaced by, yes, a programming course (but using Python, and not the original Fortran).
  5. In tracking down the materials for the programming course described above, I re-discovered something far older. It is linked here and is (some of) the Fortran source code I wrote as a PhD student in 1974 1972. So I will indulge in a short digression. My Ph.D. involved measuring rate constants, and the accepted method for analysing the raw kinetic data was using graph paper. For first order rate behaviour, this required one to measure a value at time=∞, which is supposed to be measured after ten half-lives. I was too impatient to wait that long, and worked out that a non-linear least squares analysis did not require the time=∞ value; indeed this value could be predicted accurately from the earlier measurements. So in 1974, I wrote this code to do this; no graph paper for me! Also for good measure is a least squares analysis of the Eyring equation. And you get proper standard deviations for your errors. In retrospect I should have commercialised this work, but in 1974, almost no-one paid money for software! What a change since then. I must try recompiling this code to see if it still works! And for good measure, here is a Huckel MO program I wrote in 1984 or earlier (I did compile this recently and found it works) and here is a little program for visualising atomic orbitals.
  6. In January 1994, I was asked to create a web page for the WATOC organisation. This certainly predated the web sites for e.g. the RSC, the ACS, indeed famous sites such as the BBC and Tesco (a large supermarket chain) which only started up in mid 1994. The WATOC site itself moved a few years ago.
  7. This is one of those wonderfully naive things I started in 1994, and which did not last long (in my hands). Nowadays, the concept lives on as MOOCs. Note again the almost complete expiry of the hyperlinks.
  8. This is a project we also started in 1994, Virtual reality[2],[3]. The idea was that if HTML was text-markup, VRML was going to be 3D markup. VRML itself never quite caught on, but it is having a new life as a 3D printing language!
  9. And by 1995, I felt confident enough in my ability to (edit) HTML, that we started a virtual conference in organic chemistry (we did four of them in the end). I remember the first one involved contributors sending me a Word version of their poster, and I did all the work in converting it into HTML. Such virtual conferences still run, but in truth most participants still prefer to travel long distances to go drink a beer with their chums, rather than hack HTML.

I am going to stop now, since this is far too much wallowing in the past. But at least all this stuff is not (yet) lost to posterity.

References

  1. H.S. Rzepa, B.J. Whitaker, and M.J. Winter, "Chemical applications of the World-Wide-Web system", Journal of the Chemical Society, Chemical Communications, pp. 1907, 1994. https://doi.org/10.1039/c39940001907
  2. O. Casher, and H.S. Rzepa, "Chemical collaboratories using World-Wide Web servers and EyeChem-based viewers", Journal of Molecular Graphics, vol. 13, pp. 268-270, 1995. https://doi.org/10.1016/0263-7855(95)00053-4
  3. O. Casher, C. Leach, C.S. Page, and H.S. Rzepa, "Advanced VRML based chemistry applications: a 3D molecular hyperglossary", Journal of Molecular Structure: THEOCHEM, vol. 368, pp. 49-55, 1996. https://doi.org/10.1016/s0166-1280(96)90535-7

Publishing a procedure with a doi.

Wednesday, October 2nd, 2013

In the two-publisher model I proposed a post or so back, I showed an example of how data can be incorporated (transcluded) into the story narrative of a scientific article, with both that story and the data each having their own independently citable reference (using a doi for the citation). Here I take it a step further, by publishing a functional procedure in a digital repository[1] and assigned its own doi:10.6084/m9.figshare.811862.

The following HTML

<iframe src="http://wl.figshare.com/articles/811862/embed?show_title=1" height="443" width="500" frameborder="0"></iframe>

can then be incorporated into any Web page, including this post, to invoke the service. What does this do? It takes a pre-prepared Gaussian-style cube file containing values of the electron density of a molecule, and converts this into non-covalent-interaction (NCI) isosurfaces[2] (as described here). Two new two files, a .xyz coordinate file and a .jvxl isosurface file (see here for an example of its application) are written to the user’s local file space. These files in turn can be integrated into an interactive data presentation and this new object can have a doi.

So now we see how unique identifiers can be used with a digital repository to:

  1. Publish a data calculation and assign it a doi
  2. A script or procedure (as a Web Service) to convert the preceding data can itself be published and assigned a doi
  3. Step two is then invoked using that doi, and the output(s) can be also be raw into a digital repository, or wrapped beforehand in some manner to produce a visual presentation of this new data before being assigned a doi
  4. All three components, if needed, can now be cited in a narrative article describing the science, and this too of course may (after peer review) also receive its own doi
  5. The first three components can, if needed, be transcluded into the fourth to create the final composite appearing in the journal (or blog post as here). 

So below is this service. You can either use it here, or simply resolve the doi above into a separate web page. This version uses Java, and so you have to be prepared to answer questions about security etc. An alternative version not using Java (based on JSmol) is probably too slow; sometimes the procedure has to convert 300+ Mbytes of Gaussian cube, and take about 30 seconds to do so.

At any rate, if you have read any of my posts which show NCI isosurfaces, and wondered how to do it for yourself, here is your chance!

References

  1. H.S. Rzepa, "Script for creating an NCI surface as a JVXL compressed file from a (Gaussian) cube of total electron density", 2013. https://doi.org/10.6084/m9.figshare.811862
  2. E.R. Johnson, S. Keinan, P. Mori-Sánchez, J. Contreras-García, A.J. Cohen, and W. Yang, "Revealing Noncovalent Interactions", Journal of the American Chemical Society, vol. 132, pp. 6498-6506, 2010. https://doi.org/10.1021/ja100936w