My previous posts have covered the ionization by a small number of discrete water molecules of the series of halogen acids, ranging from HI (the strongest, pKa -10) via HF (weaker, pKa 3.1) to the pseudo-halogen HCN (the weakest, pKa 9.2). Here I try out some even stronger acids to see what the least number of water molecule needed to ionize these might be.
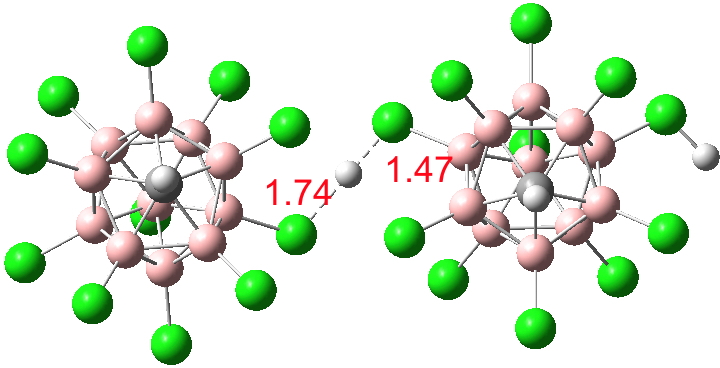
Firstly what must surely be the ultimate acid H(CHB11Cl11), discovered by Christopher Reed[cite]10.1021/ja058581l[/cite] in 2006. This is so strong that it appears that it can even largely ionize itself; the form on the right (below) is the cationic acid, the form on the left is its anionic base. The proton itself is bridged[cite]10.5517/CCNBRWL[/cite] between the two in a manner similar to the structure of one form of HCl.4H2O reported in the earlier post on the topic.
Click for 3D
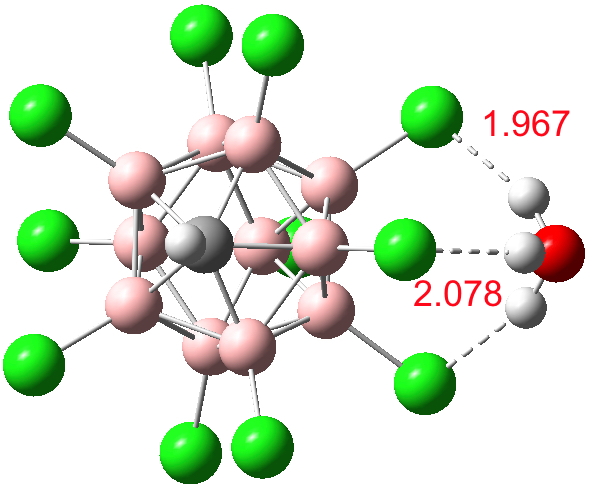
So it comes as no surprise‡ to find[cite]10.14469/ch/191134[/cite] that just one water molecule can also ionize H(CHB11Cl11) to the anionic form (CHB11Cl11)–.
Click for 3D
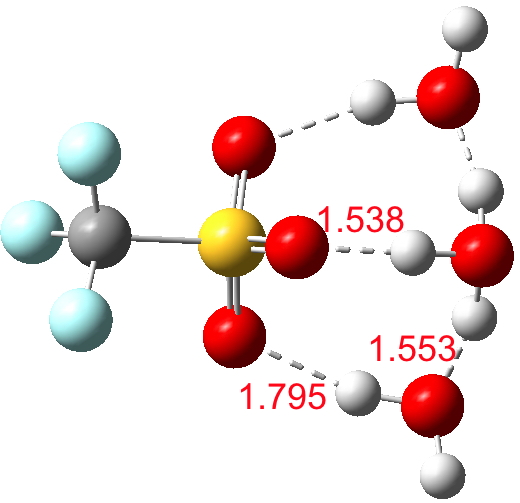
How about triflic acid, CF3SO2OH, pKa -16), which is also a fair bit more acidic than HI? Here, only three waters are needed (ωB97XD/6-311++G(2d,2p) prediction) to ionise to triflate anion.[cite]10.14469/ch/191129[/cite]
Click for 3D
So, if there a system which is ionised by precisely two water molecules I will record it here.
‡Perhaps also no surprise is that one H2S molecule can also perform this ionisation.[cite]10.14469/ch/191135[/cite] This leads us into another exploration, using molecules other than water to perform these ionisations.
Infra-red spectroscopy of molecules was introduced 110 years ago by Coblentz[cite]10.1103/PhysRevSeriesI.20.273[/cite] as the first functional group spectroscopic method (” The structure of the compound has a great influence on the absorption spectra. In many cases it seems as though certain bonds are due to certain groups.“). It hangs on in laboratories to this day as a rapid and occasionally valuable diagnostic tool, taking just minutes to measure. Its modern utility rests on detecting common functional groups, mostly based around identifying the nature of double or triple bonds, and to a lesser extent in differentiating between different kinds of C-H stretches[cite]10.1002/chem.201200547[/cite] (and of course OH and NH). One common use is to identify the environment of carbonyl groups, C=O. These tend to come in the form of aldehydes and ketones, esters, amides, acyl halides, anhydrides and carbonyls which are part of small rings. The analysis is performed by assigning the value of the C=O stretching wavenumber to a particular range characteristic of each type of compound. Thus ketones are said to inhabit the range of ~1715-1740 cm-1 and simple esters come at ~1740-1760 cm-1, some 20-30 cm-1 higher. Here I try to analyse how this difference arises.
The analysis is based on trying to understand how the components of an ester interact with each other, and in particular how the alkyl oxygen interacts with the carbonyl group. Three electronic interactions in particular can be focused on (below). The first two of these weaken the C=O bond; the last strengthens it. So which effect wins out?
The donation of an in-plane σ lone pair (Lpσ) on the alkyl oxygen into the C=O σ* acceptor (red arrows)
The donation of an out-of-plane π lone pair (Lpπ) into the C=O π* acceptor (blue arrows)
The donation of an in-plane σ lone pair (Lpσ) on the acyl oxygen into the C-O σ* acceptor (green arrows)
I will start with computational models, which have the advantage that one can dissect how the vibrations arise. The first two rows show a comparison of the experimental gas phase values[cite]10.1063/1.461230[/cite] with a standard “medium level” ωB97XD/6-311G(d,p) calculation. The discrepancy amounts to ~100-114 cm-1.
There are several possible causes for such errors:
The calculation is for harmonic frequencies; whereas those measured are anharmonic.
DFT-level force constants at modestly sized basis set levels are known to be too large compared with a complete basis set calculation (CBS). It used to be the practice in fact to routinely scale the force constants down by ~10% to correct for this effect.
The correlation treatment in a DFT approach is incomplete (an error which may in fact be also absorbed into the 10% correction noted above).
So to really get to the root of why an observed ester carbonyl stretch is higher than that of the equivalent ketone, we have to get a handle on these effects above.
One can calculate cubic and quartic force constants to get an estimate of the effect of anharmonicity on the (harmonic/quadratic) values, which emerges as 23-28 cm-1
Upping the level of the basis set to aug-cc-pVQZ (close to, but not quite a CBS) reveals further corrections of 20-24 cm-1 .
Replacing the DFT method with a CCSD(T)-level treatment of the dynamic correlation gives corrections of 34 and 59 cm-1 respectively for ester and ketone. Assuming the corrections can be treated additively, one can apply the first two to the third, producing “corrected” CCSD(T)/6-311G(d,p) values which are only about 12-13 cm-1 higher than the observed value. This remaining discrepancy is probably due to the difference between aug-cc-pvQZ and a complete basis set (CBS) and any remaining errors in the correlation modelled by CCSD(T). We can be assured now that our theory is reproducing experiment very well.
Now that we can assess the accuracy of our computational methods, we need to try to relate the results to the C=O bond itself. Does turning a ketone into an ester really make it stronger? To directly compare the C=O bond of two different molecules, we need to eliminate the effects of mixing the C=O normal stretching mode with similar energy modes arising from other parts of the molecule. A simple way of estimating this is to set the mass of all but two of the atoms to a very small value (0.00001), leaving only the masses of the C and O as normal; this is shown as a reduced frequency in the table above. The harmonic CCSD(T)/6-311G(d,p) C=O “pure” mode reduces to 1764 for methyl ethanoate and 1743 cm-1 for propanone. So after all of this, at least we now know that the force constant for the C=O stretch really is stronger for an ester. The green arrows seem to win out over the blue/red ones.
One calculation too many? The (Wiberg) bond order for the C=O bond can be derived from the wavefunctions. Its value is 1.635 for ester, and 1.681 for ketone (CCSD/6-311G(d,p)) or 1.766/1.848 (ωB97XD/aug-cc-pvQZ). This is the opposite to that inferred from the carbonyl stretch, and hence favours the blue/red arrows over the green arrows. I set out in this post to try to bring clarity to how an adjacent oxygen influences how we think of the properties of the C=O functional group, but as happens quite often, the answer you get depends on the measurement you make.
‡ The solution values in e.g. acetonitrile are reduced by ~20 cm-1, reaching the values often quoted in text books for these functional groups. † The effect on C-H values is greater, e.g. a reduction from 3186 to 2967 cm-1.
Acknowledgments
This post has been cross-posted in PDF format at Authorea.
In 1986 or so, molecular modelling came of age. Richard Counts, who ran an organisation called QCPE (here I had already submitted several of the program codes I had worked on) had a few years before contacted me to ask for my help with his Roadshow. He had started these in the USA as a means of promoting QCPE, which was the then main repository of chemistry codes, and as a means of showing people how to use the codes. My task was to organise a speakers list, the venue being in Oxford in a delightful house owned by the university computing services. Access to VAX computers was provided, viaVT100 terminals. Amazingly, these terminals could do very primitive molecular graphics (using delightfully named escape codes, which I learnt to manipulate).
An expert on the use of such codes was George Purvis, who hailed from the quantum theory project at the University of Florida at Gainesville. He had developed QUIPU for VAX/VT100 and together we had much fun setting things up for the participants at these QCPE workshops (which ran 1986-1990). During one session, George asked me whether I thought a properly implemented and reasonably cheap graphical user interface might have commercial potential in chemistry. Remember, the VAX/Evans&Sutherland PS390 system we had acquired in 1987 was NOT cheap. I must have encouraged him, since in 1990 George (now part of the CACHE, or computer assisted chemistry, group at the Tektronix corporation in Beaverton) had brought to market a “shrink-wrapped” system which did just that. This was, in many ways, well ahead of its time. It was based on a then state-of-the-art Macintosh computer, with a co-processor that could crunch floating point numbers quite fast (this was then very rare in so called personal computers, being reserved for supercomputers). It had a unique spherical trackball (almost a haptic device) for rotating molecules, and a liquid crystal polarized screen running at 120Hz (60Hz for the left eye, 60Hz for the right eye). Wearing polarized (passive) glasses, the stereo 3D effect via the 19″ screen (big for its day) was awe inspiring. What is more, two people could sit at it and both see molecules in stereo.
We managed to get a grant to purchase such a system, and I well remember taking it to the 1990 Oxford workshop (I had now taken over from Richard for the UK workshops) in the back of my car. This involved driving to my office on a Saturday, and heaving the thing out. A security guard saw me doing this and arrested me. After much ado, I was forced to take the CACHE to my office and told not to try that again. I waited 30 minutes, and took it out the back door (which nowadays has a black security camera watching it, but in those days was not guarded) and on to Oxford (checking for police sirens all the way). I think I made the trip to Oxford with this thing in the back of the car one more time, where I used it to give a poster at a conference, handing out the 3D glasses to anyone who expressed an interest (and reclaiming them rapidly if they posed no interesting question). I still fancy this was almost unique in the history of posters (which tend, even nowadays, to be printed on paper). Reflecting on this, I realise that my total aversion to Powerpoint probably dates from that time.
At this stage, I will tell you about some of the science we did with the remarkable stereographical 3D CACHE system. The first is our realisation that the Pirkle reagent exhibits a π-facial hydrogen bond from the OH group (DOI: 10.1039/C39910000765). Indeed, I notice that four of the posts here relate to this topic! Once you know what you are looking for, its trivial to spot. But I recollect that the crystallographers who did the structure for us had failed to identify this unusual hydrogen bond; it took the CACHE, and its 3D glasses, for us to notice it.
But the really important breakthrough using CACHE was a different molecule, halofantrine (X=Y=Cl, DOI: 10.1039/C39940001135) an antimalarial pharmaceutical molecule.
Halofantrine.
At this stage, pharmaceutical companies were assiduously resolving chiral compounds into their enantiomers and testing each separately for biological activity. It had been noticed that whereas X=H, Y=Cl could NOT be resolved on a chiral column, replacing X=H by X=Cl suddenly made it possible to do so. But why? Well, in order to inspect this with the CACHE system, we asked for the crystal structure to be done. Back it came and Mike Webb and I sat inspecting the coordinates in full stereoscopic glory, as I recollect for about an hour, twiddling the viewpoint here and there. Each of us would take over the haptic trackball for 10-15 minutes, and we would then discuss what we saw. In one of those magical moments (I can assure you that shivers do run down one’s back at moments like this) we spotted that X=H had a strong hydrogen bond to the OH of another molecule, whereas X=Cl did not. Suppressing that C-H…O interaction forces the molecule to π-π stack instead, and this mode now enables it to better interact with the chiral column and hence resolve.
Halofantrine. Click for 3D.Some of that magic is recreated above. If you click on the image, the coordinates will be loaded. Now that the relevant interaction is highlighted, it is so easy to spot you might wonder how anyone would have ever missed it!. At any rate, shortly after writing this article, I sat down to write another on a new phenomenon called the World-Wide-Web. And to illustrate why the Web might become important, we highlighted halofantrine, and how the Web could carry such immediately visual information to its readers. This blog, in effect, is a direct descendent of that article (which, by the way, is still available in HTML form here). So, 3D graphics led to the (chemical) Web. What a tangled web indeed.
And to end with 3D. I live in hope that shortly, stereoscopic tablets will make an appearance. Given that the CACHE system noted above was heavy (it was a major struggle moving the monitor into the car, as described above), it will be an amazing evolution to see (almost) pocket sized devices being carried around for the same purpose.