In this post, I pondered upon the C=O infra-red spectroscopic properties of esters, and showed three possible electronic influences:
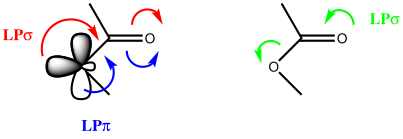
The red (and blue) arrows imply the C-O bond might shorten and the C=O bond would lengthen; the green the reverse. So time for a search of the crystal structure database as a reality check. The query is as follows:

The response shows the bimodal distribution with as expected the s-cis conformation dominating. There is indeed a hint that for the s-cis, the C-O distance is rather shorter than for the s-trans conformation.

Repeating the search, but specifying that the temperature of data acquisition is < 90K, one gets a much clearer indication of the difference in bond lengths.

This alternative representation shows the C-O and the C=O distances, with red indicating s-trans and blue indicating s-cis conformations (T < 140K). The red dots occupy a bottom right cluster for which the C-O distance is longer and the C=O shorter than the corresponding blue cluster.

Again reducing the temperature of data collection to < 90K shows a rather weak inverse correlation between the two distances for eg the blue dots.

A shame however that this database does not hold IR values for the carbonyl stretches. I am sure correlations must exist, but how to get at them (other than manual collection of data).