Archive for the ‘General’ Category
Thursday, November 10th, 2011
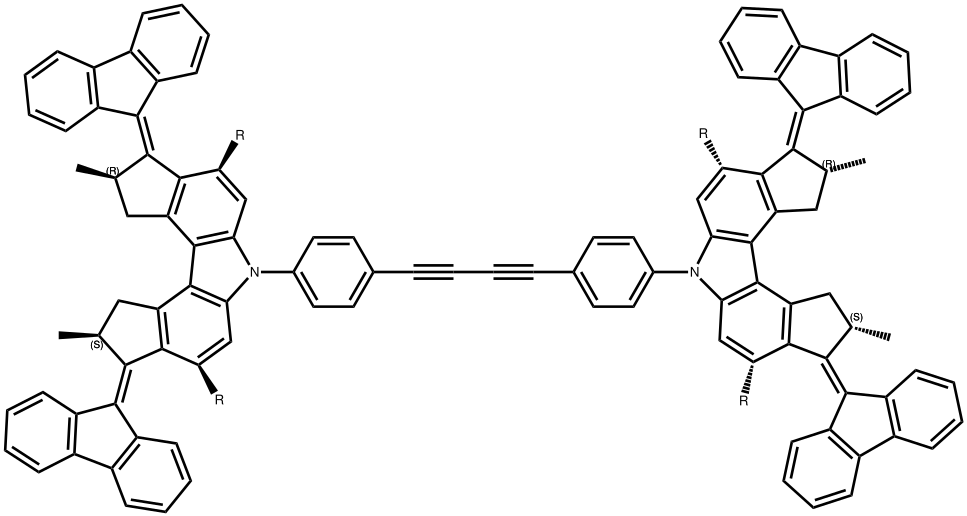
Fascination with nano-objects, molecules which resemble every day devices, is increasing. Thus the world’s smallest car has just been built. The mechanics of such a device can often be understood in terms of chemical concepts taught to most students. So I thought I would have a go at this one!

A molecular car (from 10.1038/nature10587)
The car comprises a single (relatively small) molecule, shown above as the authors represented it. The motion along a surface comprised of copper atoms is driven by light as fuel coupled with encouragement from an STM probe. The distance travelled in a straight line was about 6nm in ten steps (note the nanodistance), although the average speed for the complete journey is not recorded. It is probably safe to say it was not recorded using a speed camera!

The car rattling along a copper surface (grey).
The chemistry is shown below. The car has four wheels (the fluorene units) which rotate about an C=C double bond axle using light as the fuel (a configurational change). The component labelled helix inversion can also be described by the chemical name atropisomerism, a topic I dealt with earlier with the example of Taxol and which is a conformational change.

The nitty-gritty of the car's engine.
These two processes are used to rotate the wheels in the sequence shown below (after which the wheels return to their starting point).

The four stages of powering the car (from 10.1038/nature10587)
I set out to build the car by optimising the 3D geometry of the molecule. This so that I could view the device from any direction (not just the one represented in the diagrams above). I also felt it important to estimate the change in energy of the car as the wheels rolled (something not touched upon in the original article). A good place to start would be to raid the supplementary information associated with the article. This comprises a PDF document and four movies. As it happens, none of these contain 3D coordinates for the molecule. Well, in truth this is not unusual, and I am used to such absence by now. Ah well, I would start from the top diagram, which is a schematic 2D representation of the molecule. As you can read in this post, such representations can often be illusory, or even contradictory. One is indeed lucky if they are free of ambiguity. Thus:
- The stereogenic centres are fine, they are labelled (R) and (S), and they provide an important aspect of the mechanism for allowing the motions of the four wheels to be coordinated such that the car drives in a straight line. Much is made of this aspect in the article.
- It is the atropisomerism that starts to cause problems. Here the diagram contains emboldened bonds carved into a benzene ring. This convention was first proposed by Hubert Maehr in 1985, but his intended use has since been much abused. As I fear it is here. Although it is difficult to be certain, the benzo groups in the car are annotated with several Maehr-like emboldened bonds, and a few non-Maehr wedged bonds as well. It is all meant to indicate perspective, and probably not intended in the Maehr sense at all.
- That latter feeling is reinforced when the benzo groups of the fluorene unit are annotated with dashed bonds replacing the single bonds in the Kekule resonance structure. Normally, a C- – -C is taken to indicate a breaking, or transition bond, but here it is again just an attempt at perspective (and a new addition to the bond menagerie).
Well, it is possible to build a 3D model armed with these instructions (although it has to be done visually, with constant comparisons with the space fill representations in the article).
- Here is my take on the starting point for the car:

The initial conformation of the molecular car. Click for 3D.
- The car starts its journey by a light-driven rotation of the C=C bonds to form an isomer (about 8 kcal/mol higher according to my estimate using PM6).

Car after step 1, double bond isomerisation. Click for 3D.
- There is then an STM-induced helix inversion, or atropisomerism. The two benzo groups are induced to swap over, much in the manner of bi-phenyls. The energy at this point is identical to the starting position. It is worth noting that the molecule was not returned to this position by reversing the first C=C rotation, but by two quite different operations (light and STM-electrons). I presume this was done to ensure the wheels turn in a constant direction, and do not simply flip back and forth randomly.

Car after step 2, helix inversion. Click for 3D.
- A final light-induced twist of the double bond (the energy is again about 8 kcal/mol higher than the start point)

Car after step 3, double bond isomerism. Click for 3D.
- and another STM-induced helix inversion returns the car to ~0.6nm on from its starting position.
So to understand nanotechnology and nano-sized objects, all you need is a good training in introductory chemistry! But a plea please to nano-scientists. Could you please include 3D coordinates for your wonderful machines. Movies are fine, but to really see what is going on, I would suggest you need proper 3D models (not least because you can then use these immediately to test my assertions about the energies of the various conformations).
Oh, I cannot resist observing that the group reporting this work probably do not ride motorcycles!
Postscript: The optimised ωB97XD/6-31G(d) geometries for the two poses of the car are to be found at 10042/to-10227 and 10042/to-10219 The total energy difference is 15.5 kcal/mol (compared with 8 at the PM6 level).
Tags:car drives, car rattling, chemical concepts, chemical name atropisomerism, chemical perspective, conformational analysis, day devices, energy, energy difference, Hubert Maehr, molecular car, nanocar, PDF, smallest car, Taxol
Posted in General, Interesting chemistry | 3 Comments »
Friday, November 4th, 2011
An attosecond is 10-18s. The chemistry that takes place on this timescale is called electron dynamics. For example, it is the time taken for an electron to traverse the 1s orbit in a hydrogen atom. And chemists are starting to manipulate electrons (and hence chemistry) on this timescale; for example a recent article (DOI: 10.1021/ja206193t) describes how to control the electrons in benzene using attosecond laser pulses.
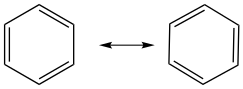
The diagram above is famously attributed to Kekulé, and we now teach that this diagram represents resonance structures. This term implies electron (rather than nuclear) dynamics, which results in us only being able to observe an averaged structure with six equivalent C-C bonds. Kekulé himself (see this review) could have no way of knowing what the timescale was that his representation implied, but he certainly must have thought it was fast. What is rarely mentioned in textbooks however is how fast it actually is. If the timescale were to be less then say a nanosecond (10-9s) then we would classify such a process not as a resonance but as a valence isomerism. This does implicate nuclear motions, and such would be the appropriate description for the isomerism of say cyclo-octatetraene, which is famously slow enough to observe by NMR (see 10.1039/P29920001951). If the timescale were to be a femtosecond (10-15s) this would correspond to molecular vibrations, and benzene indeed has an observable normal vibrational mode that corresponds more or less to the representation above (the hydrogens also wag a bit). This mode even has a name, the Kekulé mode. But even this is not fast enough for the intent of the diagram above, which describes what the electrons (and not any moving nuclei) are up to.
The article I mentioned at the start, by Inga Ulusoy and Mathias Nest probes exactly this aspect at the attosecond timescale. More particularly, they look into how to shape an ultra-short laser pulse to excite the electrons into excited states of benzene. This act destroys the aromaticity of the molecule, and changes the electron dynamics in the process. I should quote them here: “We have shown that by controlling the electron dynamics we can selectively switch benzene into nonaromatic target states. These target states exhibit an ultra-fast bidirectional electron circulation around the ring system.”
This is the chemistry in (a few) attosecond(s) that I titled this blog. Whilst the article noted here is theoretical, there seems little doubt that experimental studies of chemistry in an attosecond will became more common, and who knows what surprises await us. Exciting times (sorry about the pun).
I would conclude by mentioning the other extreme, chemistry in an exasecond (1018s). This happens to correspond more or less to the age of the universe! As it happens, it is not that difficult to come up with chemical processes that occur on this timescale. Any (unimolecular) process that has a free energy barrier larger than that inferred using e.g. the equation Ln k/T = 23.76 – ΔG/RT would fit. An example might be the half life for the enantiomerisation of alanine (left to its own devices, and not interfered with by e.g. catalysts).
Tags:attosecond, chemical processes, exasecond, free energy barrier, G/RT, Inga Ulusoy, laser, Mathias Nest, Tutorial material
Posted in General, Interesting chemistry | 1 Comment »
Wednesday, November 2nd, 2011
How one might go about answering the question: do alkenes promote anomeric effects? A search of chemical abstracts does not appear to cite any examples (I may have missed them of course, since it depends very much on the terminology you use, and new effects may not yet have any agreed terminology) and a recent excellent review of hyperconjugation does not mention it. Here I show how one might provide an answer.
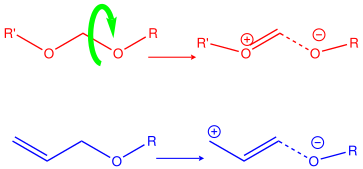
First, what is an anomeric effect? The diagram below shows the classic anomeric effect in which a donor (an oxygen lone pair) interacts with an acceptor (a C-O bond). The orientation around the single bond shown with a green arrow is crucial; the effect only happens when the donating lone pair is aligned antiperiplanar to the accepting C-O bond, at which point the lengthening of the C-O bond should be maximal (shown as a dashed line below). The blue analogue is the corresponding effect using an alkene as the donor, but retaining the C-O bond as the acceptor.
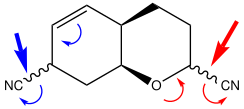
I had previously addressed this theme by discussing the molecule below. Switching the acceptor from a C-O to a C-cyano bond has the effect of inducing an axial orientation for both cyano groups, a “cyanomeric” effect! Whilst the stronger is undoubtedly the one shown in red, note the blue interaction, that involves an alkene rather than oxygen as donor.
One way of providing evidence is a crystallographic search. Here I am using Conquest, the program provided by the Cambridge crystallographic data centre, with the following specification (thanks to Andrew White for helping me frame this search!).

The search query
- The length of the C-O bond (blue arrow) is defined as a search parameter
- The absolute value of the torsion around the bond (red arrow) is also so defined
- I have restricted the acceptor to C-O bonds (this of course excludes C-CN).
- The C-O acceptor can be enhanced by bearing an electron withdrawing group, which can be e.g. carbonyl, phosphate, sulfate, perchlorate etc.
- The alkene donor can be enhanced with donating groups such as oxygen, nitrogen or carbon
- NOT Booleans are applied to restrict the substituents the alkene can carry to only sp3 carbons (or H) by excluding sp2 or sp hybridised carbons. This is to prevent the substituents from delocalizing the alkene (in effect preventing competition from these substituents), but allowing them to stabilise any induced carbocation resonance by hyperconjugation.
- The C of the C-O is specified as acyclic (to allow the torsion to in theory have any allowed value).
- The search is also restricted to structures with no disorder or other errors, and an R factor of < 0.075.
These specifications can be seen in the first hit obtained:

A hit
A total of 215 structures are found, and a scatterplot of the C-O bond length version the (abs)C=C-C-O torsion is shown below.

Scatterplot. Click to view a larger version.
There are two main clusters of hits, those with torsions close to zero, and those with torsions between ~90-120°. The latter cluster is very clearly shifted to the right of the former, indicating that on average these C-O bond lengths are longer. The red-orange-light green hits (1.46-1.50Å range) are to be found exclusively in the “antiperiplanar” cluster. One might conclude that statistically, the π-anomeric effect appears real. Of course, there may be many other reasons why the C-O bond is lengthened, and each of the molecules above should be individually inspected to exclude these.
This sort of structural search takes only minutes (if you know how to formulate it) and I would certainly encourage you to try it out on your own favourite effect! See if the excellent and open CrystalEye resource gives a similar answer (the Conquest /CCDC system is commercial, and not open).
H. S. Rzepa, 2011-11-02. URL:http://www.ch.imperial.ac.uk/rzepa/blog/?p=5368. Accessed: 2011-11-02. (Archived by WebCite® at http://www.webcitation.org/62tOSgnzK)
Tags:Andrew, Andrew White, anomeric, chemical abstracts, conformational analysis, crystallographic search, disorder, search parameter, search query, structural search takes
Posted in Chemical IT, General | 2 Comments »
Monday, October 31st, 2011
Most of the chemical structure diagrams in this blog originate from Chemdraw, which seems to have been around since the dawn of personal computers! I have tended to use this program to produce JPG bitmaps for the blog, writing them out in 4x magnification, so that they can be scaled down for display whilst retaining some measure of higher resolution if needed for other purposes. These other purposes might be for e.g. the production of e-books (using Calibre), the interesting Blog(e)book format offered as a service by Feedfabrik, or display on mobile tablets where the touch-zoom metaphor to magnify works particularly well. But bitmap images are not really well future proofed for such new uses. Here I explore one solution to this issue.
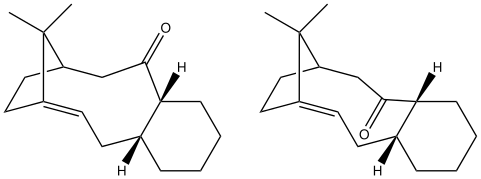
I have previously mentioned scalable vector graphics (SVG) as an alternative, and fortunately the production of such has become routine.3 The diagram above2 is indeed SVG (and if you cannot see it, then try a modern SVG-capable browser1). It was produced thus:
- Drawn in Chemdraw
- Exported as Encapsulated postscript
- Imported into Scribus, an Open Source desktop publishing program (where it can be annotated/edited if need be)
- This program will also need Ghostscript installed to handle the EPS
- and exported from Scribus to SVG.
- Notice how the diagram above automatically scales to fill the width of the page. If you click on it, you get the diagram on its own. If you zoom the browser window, it should scale perfectly.
- I note that these SVG diagrams work well in e-books or blogbooks.
There seem to be many other (open) programs out there which support SVG, so the above combination is not necessary the only one, or indeed the best. There is one other aspect which might be mentioned. The old GIF or JPG bitmap formats do have good meta-data support, such as
EXIF,
GPS or
XMP. These invisible data have often been used to embed a molecular connection table into a GIF or JPG file, such that the original molecular data can be reconstituted from the image file. Unfortunately, there are no real standards for doing this, and so round-tripping the data is probably a closed process within a specific software environment. However, because SVG is an XML format, it can be readily made to carry such information in a fully inter-operable manner. For example, one could easily embed a CML description of the molecule into its own container (namespace) in the SVG file. For the purposes of rendering an on-screen image, this extra information is of course ignored.
1 I notice that Internet Explorer 9 (both 32- and 64-bit versions) will display (and save) the above diagram if you click on it, but it cannot (yet) be inlined into the post, although the documentation implies it should.
2 The version below is the conventional JPG form (click on it to see the original 4x version).

Diagram displayed using JPG.
3. Historical note. Peter Murray-Rust and I have been promoting SVG for use in chemistry for 11+ years now. For one ancient page, see here. The syntax has decayed somewhat, but some of the diagrams still work!
Tags:chemical diagrams, chemical structure diagrams, desktop publishing, e-books, Feedfabrik, GIF, GPS, Internet Explorer, Peter Murray-Rust, software environment, Vector Graphics
Posted in Chemical IT, General | 13 Comments »
Monday, October 24th, 2011
I have for perhaps the last 25 years been urging publishers to recognise how science publishing could and should change. My latest thoughts are published in an article entitled “The past, present and future of Scientific discourse” (DOI: 10.1186/1758-2946-3-46). Here I take two articles, one published 58 years ago and one published last year, and attempt to reinvent some aspects. You can see the result for yourself (since this journal is laudably open access, and you will not need a subscription). The article is part of a special issue, arising from a one day symposium held in January 2011 entitled “Visions of a Semantic Molecular Future” in celebration of Peter Murray-Rust’s contributions over that period (go read all 15 articles on that theme in fact!).
Here I want to note just two features, which I have also striven to incorporate into many of the posts this blog (which in one small regard I have attempted to formulate as an experimental test-bed for publishing innovations). Scalable-Vector-Graphics (SVG) emerged around the turn of the millennium as a sort of HTML for images. To my knowledge, no science publisher has yet made it an intrinsic part of their publishing process (although gratifyingly all modern browsers support at least a sub-set of the format). Until now (perhaps). Thus 10.1186/1758-2946-3-46 contains diagrams in SVG, but you will need to avoid the Acrobat version, and go straight to the HTML version to see them. However, what sparked my noting all of this here was the recent announcement by Amazon that they are adopting a new format for their e-books, which they call Kindle Format 8 or KF8 (the successor to their Mobi7 format). To quote: “Technical and engineering books are created more efficiently with Cascading Style Sheet 3 formatting, nested tables, boxed elements and Scalable Vector Graphics“. This is wrapped in HTML5 to be able to provide (inter alia) a rich interactive experience for the reader. In fairness, there is also the more open epub3 which strives for the same. Other features of HTML5 include embedded chemistry using WebGL and the same mechanisms are being used for the construction of modern chemical structure drawing packages.
It remains to be seen how much of all of this will be adopted by mainstream chemistry publishers. Here, we do get into something of a cyclic argument. I suspect the publishers will argue that few of the authors that contribute to their journals will send them copy in any of these new formats and that it would be too expensive for them to re-engineer these articles with little or no help from such authors. The chemistry researchers who do the writing (perhaps composition might be a better word?) might argue there is little point in adopting innovative formats if the publishers do not accept them (I will point out that my injection of SVG into the above article did have some teething problems). For example, you will not find SVG noted in any of the “instructions for authors” in most “high impact journals” (or, come to that, HTML5).
If one looks at the 25 year old period, in 1986 all chemistry journals were distributed exclusively on paper. My office shelves still show the scars of bearing the weight of all that paper. Move on 25 years, and all journals almost without exception are now distributed electronically. I suspect the outcome in many a reader’s hands is simply that they (rather than the publisher) now bear the printing costs themselves (despite or perhaps because of the introduction of electronic binders such as Mendeley). But it will only be when the article itself grows out of its printable constraints, and hops onto mobile devices such as Kindles and iPads in the promised (scientifically) interactive and data-rich form, that the true revolution will start taking place.
A final observation: you will not readily obtain the interactive features of 10.1186/1758-2946-3-46 on e.g. an iPad or Kindle because the Java-based Jmol is not supported on either. But Jmol has now been ported to Android, and its certainly one to watch.
Tags:Acrobat, Amazon, Android, chemical structure drawing packages, e-books, HTML, HTML5, iPad, iPads, Java, KF8, Kindle, mobile devices, opendata, Peter Murray-Rust, printing costs, SVG, Vector Graphics
Posted in Chemical IT, General | 3 Comments »
Thursday, October 13th, 2011
Bonds are a good example of something all chemists think they can recognise when they see them. But they are also remarkably dependent on context. We are running a molecular modelling course at the moment, and I found myself explaining to someone how very context-sensitive they can be. I thought it might be useful to collect my thoughts here.
- The most primitive bond is the connection type. This is used in chemical informatics to define a connection table for a molecule, which is used by all the major chemical databases to index and hence search for molecules. It is also used by the InChI identifier to create the InChI key, and of course SMILES strings. The connection bond has no other properties (such as its bond order etc), but it is assumed to be covalent rather than ionic.
- The next is the display bond. This is used by chemical visualisation programs; it is normally created by the code based on very simple rules, such as how far apart the two (or more) atoms are. Such bonds are normally drawn with straight lines, of which there can be up to five (or six at a pinch) nowadays. There is however only a fuzzy convention for how non-integer bond orders are represented. A dashed line can be added (and it might be the only line for weaker types such as hydrogen bonds), but its clear this display convention is suffering at this stage.
- Perhaps to keep the synthetic chemists happy, I should add two flavours to this category, the stereochemical display bond, which attempts to add a 3D context but in truth does this less than perfectly and the retrosynthetic bond. I will not dwell.
- Then there is what I call the mechanical bond. This is used in molecular mechanics force fields. It is a declared bond, i.e. you declare where you want the bond to be, and once that is done, it remains there (it is thus never broken). Each declaration is associated with (quadratic) force constants, which taken as a whole define the force field.
- Next comes the quantum chemical bond. This is defined by a wavefunction, which in turn tells us about the electron density. This, to be frank, can be a can of worms. There must be dozens of ways of interpreting the electron density in terms of a bond type. I have used just one of these on this blog, the ELF procedure, which gives an estimate of how many electrons are involved in any bond (and these are always non-integers). Books could be written about this topic, but I will mention just three varieties which indicate how confusing quantum bonds can become. These are the homo(aromatic) bond, which itself comes in two varieties, bond and no-bond types (DOI: 10.1021/jp026521l), bent bonds and transition state bonds. Phew!
- The quantum topological bond emerges from Bader’s QTAIM procedure, which provides a formal topological framework for defining what a bond is. As I noted in earlier posts, it is controversial, since it does not always reflect what chemists might regard as a useful definition that helps them do chemistry.
- Finally (?), I could add Rydberg bonds, which are mysterious formations on excited state surfaces, and which can be extraordinarily long (> 500Å), thus defying application of simple distance rules as noted in type 2 above.
It is a taken that the moment anyone tries to define boundaries and rules for bonds, people will argue against the scheme. But if you have your own type which is missing above, do let me know!
Tags:chemical databases, chemical informatics, chemical visualisation programs, quantum chemical bond, Tutorial material
Posted in Chemical IT, General | 4 Comments »
Wednesday, October 12th, 2011
In two previous posts, I have looked at why cis-butene adopts conformation (a) rather than (b). I suggested it boiled down to electronic interactions between the methyl groups and the central alkene resulting in the formation of a H…H “topological” bond, rather than attraction between the H…H region to form a weak chemical “bond“. Here I take a look at what happens when that central C=C bond is gradually removed.

Two possible conformations of cis but-2-ene.
One reaction that removes this bond (marked with a magenta arrow below) is the Diels Alder π2s + π4s cycloaddition to a butadiene.

The classic Diels Alder cycloaddition
An intrinsic reaction coordinate for this reaction looks as below: the barrier is around 25 kcal/mol and the reaction is exothermic (SVG compatible browser needed to view figure).
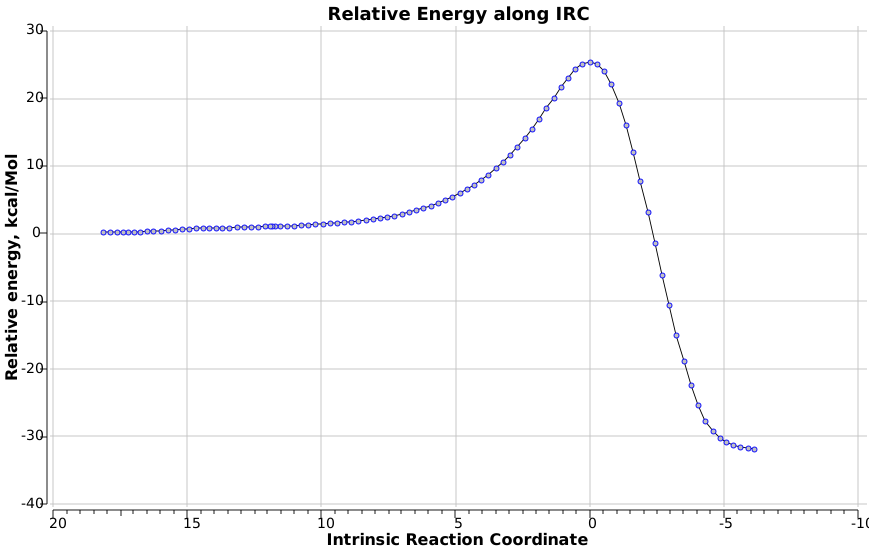
But much more interesting are the geometric responses of the two molecules as the reaction proceeds:
- Watch first the butadiene component. Its resting conformation is gauche rather than eclipsed at the central C-C single bond, with the two double bonds rotated slightly to avoid (in this case) a close H…H contact. The first step in the reaction path is to rotate the butadiene from this gauche orientation into a eclipsed conformation at that bond.
- Next, the action takes place on the cis-butene. Unlike the diene, it starts off eclipsed (due to the effects noted previously) in conformation (a) above, but as the alkene starts to weaken (and the electronic effects holding it in this shape lessen), the two methyl groups rotate into conformation (b). In effect, the electronic reorganisation has moved the close H…H contact from the alkene to the diene!
- Finally, the two C-C bonds can proceed to form, and the rest of the reaction proceeds to form the cyclohexene product.
- Keep an eye out as well for the two methyl groups on the butadiene. Watch how they too rotate near the final stages of the reaction.

Geometric responses to the cycloaddition reaction.
I have observed methyl groups in a number of reactions now via intrinsic reaction coordinates, and they do seem to be acting as flags, highlighting subtle effects in the electronic reorganisations. Rotating methyl groups should be looked at more often as harbingers of interesting effects!
Tags:Diels Alder cycloaddition, pericyclic, Tutorial material
Posted in General, Interesting chemistry | 14 Comments »
Monday, October 10th, 2011
I wrote earlier about the strangely close contact between two hydrogen atoms in cis-butene. The topology of the electron density showed characteristics of a bond, but is it a consensual union? The two hydrogens approach closer than their van der Waals radii would suggest is normal, so something is happening, but that something need not be what chemists might choose to call a “bond“. An NCI (non-covalent analysis) hinted that any stability due to the electron topologic characteristics of a bond (the BCP) might be more than offset by the repulsive nature of the adjacent ring critical point (RCP). Here I offer an alternative explanation for why the two hydrogens approach so closely.
 One of four C-H NBO donor orbitals. Click for 3D |
 The empty C=C π* orbital. Click for 3D to show both orbitals superimposed. |
We need to try to “concentrate” or “focus” the effect into the bonds of the molecule, and a good way of doing this is to calculate the NBO (natural bond orbitals). The first we focus on is localised onto one (of four) C-H bonds of the methyl group; the other is the anti bonding π* orbital of the alkene. NBO theory allows us to calculate how these two orbitals perturb each other, in the sense of the occupied orbital donating to the empty orbital. This energy is known as E(2), and for any of the four (equivalent) interactions above, it is computed at 5.17 kcal/mol. If you look closely at the orbitals, the C-H bond is leaning away from the centre, but so is the π* acceptor orbital (that is the nature of anti bonding orbitals). These characteristics improve the overlap of the orbitals, and hence tend to increase the value of E(2).
What about an alternative conformation of cis-butene in which the close contact of the H…H atoms is removed by rotation? Well, the C-H NBOs now rotate in, but the anti bonding π* orbital still tilts out. The overlap between them is no longer quite so good, and indeed the E(2) energy decreases to 4.43 kcal/mol.
 Donor C-H bond in rotated isomer of cis-butene. Click for 3D |
 NBO C=C p* orbital in rotated isomer of cis-butene. Click for 3D |
How many more orbitals should be considered? Well, the NBO technique in effect concentrates these effects into a relatively small number of orbitals (those separated by the smallest energy gap). We can also add in the four interactions between the bonding π orbital and the anti-bonding C-H* NBO. The totals for the first conformation come to 34.08 and for the second 30.44.
So we can conclude by observing that cis-butene makes a sacrifice for its greater good. Rotating the methyl groups means that the overlap of four C-H bonds with the alkene is optimised, but an undesired side effect is to induce two hydrogens to get close to each other. They would not normally be happy doing so, but the gain from the first effect is greater than the loss from the second. Whilst they may be close, chemists would prefer not to call the H-H approach a bond, even though the topology of the electron density might say it is.
By the way, this is my 150th post. I had little idea when I started that I might reach this milestone.
Tags:conformational analysis, energy, energy decreases, smallest energy gap, Tutorial material
Posted in General, Interesting chemistry | 9 Comments »
Sunday, October 9th, 2011
Steve Jobs death on October 5th 2011 was followed by a remarkable number of tributes and reflections on the impact the company he founded has had on the world. Many of these tributes summarise the effect as a visionary disruption. Here I describe from my own perspective some of the disruptions to chemistry I experienced (for another commentary, see here).

Chemical diagram, circa 1983.
The diagram above originates in 1983 just before the impact of Jobs’ vision burst upon chemistry. It was published in one of the new-generation of camera-ready journal, the objective being to reduce publication times from a typical 12-24 months down to around around three months. Camera-ready meant that the authors had to prepare a photo-ready manuscript; the role of these journals was to photograph, print and publish. The diagram above was prepared using stencils and Rotring technical pens together with Letraset lettering. The snippet above would probably take an hour or two to draft; the diagrams for an entire article were probably about 1 weeks work. Imagine how much time would be needed for a 200 page PhD thesis (some of this time was occupied by rushing out to a purchase more Letraset sheets because one had run out of say the letter r needed to represent the bromine in the above!). The diagram below was publishedin the same camera-ready journal in 1987.

Chemical diagram, circa 1987.
It was produced using Chemdraw on an Apple Macintosh computer introduced in 1984 (and which reached UK chemistry departments in 1985) and printed on an Apple laser printer. It would have taken perhaps 5 minutes to produce. More significantly, by copying and pasting (terms which need little explanation nowadays), one could re-use the diagram repeatedly as a template in a more complex scheme for little extra effort. You might argue that these two diagrams do not actually differ in quality that much (actually, the Apple-derived diagrams are of much higher quality than implied above, and the loss of quality is because the article has subsequently been scanned by the journal). But in fact the impact of Jobs’ Macintosh computer was far greater than just being able to produce nice chemical diagrams. Because it also introduced chemists to disruptive new concepts, the consequences of which are still impacting today.
The first is the idea of the re-use of digital data, as mentioned above. Once one had a diagram drawn, one could use it to almost instantly derive other properties of the molecule. For example, the molecular weight or an atom connection table. This in turn could be used to start an online search. And it was the Macintosh that really bump-started the idea of online activities.
Although chemistry had started going online around 1980 (I remember a single terminal station enabling STN express online access to chemical abstracts being introduced then, and in fact computational chemists were already online around 1974), the idea of an entire department of researchers ALL being online in their lab or office was very much the result of introducing the Macintosh in 1985. It came with a network connector at no extra cost. This in turn allowed all owners of such a computer to connect online to the (then very expensive) laser printer, and as a by-product almost, to the rest of the world! I have described some of the disruption this introduced elsewhere. By around 1987, most of our Mac users were happily going online (it has to be said that owners of IBM PCs were rarely doing so at this time). That is one of the true legacies that Jobs’ disruptive technologies introduced to us chemists.
I am going to quote Samuel Butler now, writing in 1863: “I venture to suggest that … the general development of the human race to be well and effectually completed when all men, in all places, without any loss of time, at a low rate of charge, are cognizant through their senses, of all that they desire to be cognizant of in all other places. … This is the grand annihilation of time and place which we are all striving for, and which in one small part we have been permitted to see actually realised“.
Steve Jobs made a big contribution to that general development of the human race!
Tags:Apple, by-product, chemical abstracts, disruptive technologies, Historical, IBM, laser printer, Macintosh, nice chemical diagrams, online activities, online search, Samuel Butler, Steve Jobs, Tutorial material, United Kingdom
Posted in Chemical IT, General | 1 Comment »
Friday, October 7th, 2011
The properties of electrons are studied by both chemists and physicists. At the boundaries of these two disciplines, sometimes interesting differences in interpretation emerge. One of the most controversial is that due to Bader (for a recent review, see DOI: 10.1021/jp102748b) a physicist who brought the mathematical rigor of electronic topology to bear upon molecules. The title of his review is revealing: “Definition of Molecular Structure: By Choice or by Appeal to Observation?”. He argues that electron density is observable, and that what chemists call a bond should be defined by that observable (with the implication that chemists instead often resort to arbitrary choice). Here I explore one molecule which could be said to be the focus of the differences between physics and chemistry; cis-but-2-ene.
Two possible conformations of cis but-2-ene.
The structure of this system has been determined by electron diffraction to exhibit a H…H distance of ~2.1Å as in (a), DOI: 10.3891/acta.chem.scand.24-0043. Why is this of interest? Because a rotational alternative, shown as (b) could result in a significantly longer H…H distance (~ 2.6Å). Now bear in mind that the van der Waals radius of hydrogen is estimated at ~1.2Å, and that two hydrogens will be most strongly attracted by dispersion forces when separated by ~2.4Å. As they get closer, that attraction will be counterbalanced by a repulsion, which will eventually win out. Structure (b) does not benefit from H…H dispersion attractions, but are the hydrogens in structure (a) too close to do so as well?
Well, let us adopt Bader’s approach, and look at the topology (QTAIM) of the electronic distribution in structure (a). The features to concentrate on are the purple dots, which in this analysis have been named bond critical points (BCP) and the single yellow sphere, which is a ring critical point (RCP). There are two other types of critical points, which I will call nuclear attractors (NACP) and cage points (CCP). The total occurrences of all these critical points is determined by a topological theorem (Poincare-Hopf), which states that NACP-BCP+RCP-CCP=1. You can see below that the H…H region is indeed connected by a bond critical point (none of the other purple dots are controversial). To a physicist, this is a real feature of the (observable or in this instance the calculated) electron density. In effect, it is a topological bond. Unfortunately, chemists like to think of bonds as entities which result in stability; a bond contributes to the stability of a molecule (and an anti-bond, should such exist, to instability). Hence aromaticity (=stability) vs anti-aromaticity (=instability). Chemists, by choice, might prefer not to call the H…H region a bond because it is probably not contributing to the stability of the molecule. Of course, the two camps are arguing about different things; the topology of the electron density ρ(r) vs the energy of the molecule.

QTAIM topological analysis of cis but-2-ene. Click for 3D.
Somewhat ignored in this discussion up to this point has been the yellow dot, the RCP. Firstly, notice how close it is to the H…H BCP. Secondly, notice from the Poincare-Hopf relationship that if you remove BOTH of these points, the theorem is still satisfied; a BCP and a RCP are said to be capable of annihilating each other (much like and electron and a positron might). So perhaps a chemical picture might emerge if you choose to consider BOTH points together, rather than just the BCP?
I have done so below using the NCI (non-covalent interaction) procedure (which I have commented on in many other posts here). The NCI surface is shown below, embedded within the NCI surface as purple dots are the BCP and RCP discussed above. Now, the NCI method cleverly attempts to ascertain whether a region is attractive or repulsive, and it colour codes the surface accordingly. In the below, blue is deemed attractive, and red repulsive. We immediately see that the H…H BCP is embedded in an attractive region, but the adjacent RCP is embedded in a repulsive region. Whatever attraction the BCP might be experiencing is negated by the repulsion the RCP has. The two cancel (annihilate). Taken together, the H…H region is probably repulsive (ways of quantifying how NCI regions integrate are being investigated and will be discussed in a future post). Perhaps this manner of looking at it satisfies both the physicists and the chemists?

The NCI surface for cis but-2-ene. Click for 3D.
Well, not quite. A chemist would still ask why structure (a) is preferred over structure (b), if the wider H…H region is not deemed attractive (I call it a region rather than a bond in a probably futile attempt to avoid controversy). Actually, the answer might be in how the two methyl groups each interact with the other part of the molecule, the alkene, and how that might depend on their orientation with respect to the alkene. But that analysis is for
another post!
Tags:CCP, chemical picture, chemist, conformational analysis, energy, Julia Contreras-Garcia, physicist
Posted in General, Interesting chemistry | 6 Comments »