Archive for the ‘General’ Category
Tuesday, September 20th, 2011
A Matryoshka doll is better known as a Russian nesting doll. They can have up to eight layers. Molecules can only emulate two layers, although see here for a good candidate for making a three-layered example (the inside layer is C60, which itself might encapsulate a small molecule. See also DOI: 10.1021/ja991747w). These molecular dolls can be created out of quite simple molecules. Here I explore just one, and focus on what is happening inside!

The basic component of a molecular capsule.
The above represents the “tennis ball” component of a molecule first made by Branda, Wyler and Rebek (DOI: 10.1126/science.8122107) in 1994. It has four pairs of carbonyl/NH units, and two of these molecules can stitch together to form an almost spherical capsule. Into this can pop smaller molecules, and in this case methane was persuaded to enter (highlighted with a magenta arrow below).

A molecular Russian doll with methane inside. Click for 3D
Finding out the structure of these dolls can be a tricky business. More often than not, they do not crystallise nicely enough to determine this by X-ray analysis (the structure of this one has never been reported, the structure above is a calculation), and even if the basic container could be analysed, the small molecules inside often rattle around too much (
i.e. they are disordered) for their optimum position to be identified. Rebek and co resorted to
1H NMR spectroscopy. If you read their paper, you will find that the chemical shift of the four methane protons comes at -0.91 ppm if inside the cavity, and at +0.23 outside. These sorts of induced shifts (they can be very much larger) makes the identification of more complex molecules which may be inside the cavity a fraught business. Is there another method? Here I suggest that the
1H NMR spectrum can be calculated to sufficient accuracy to be able to comment on that internal structure.
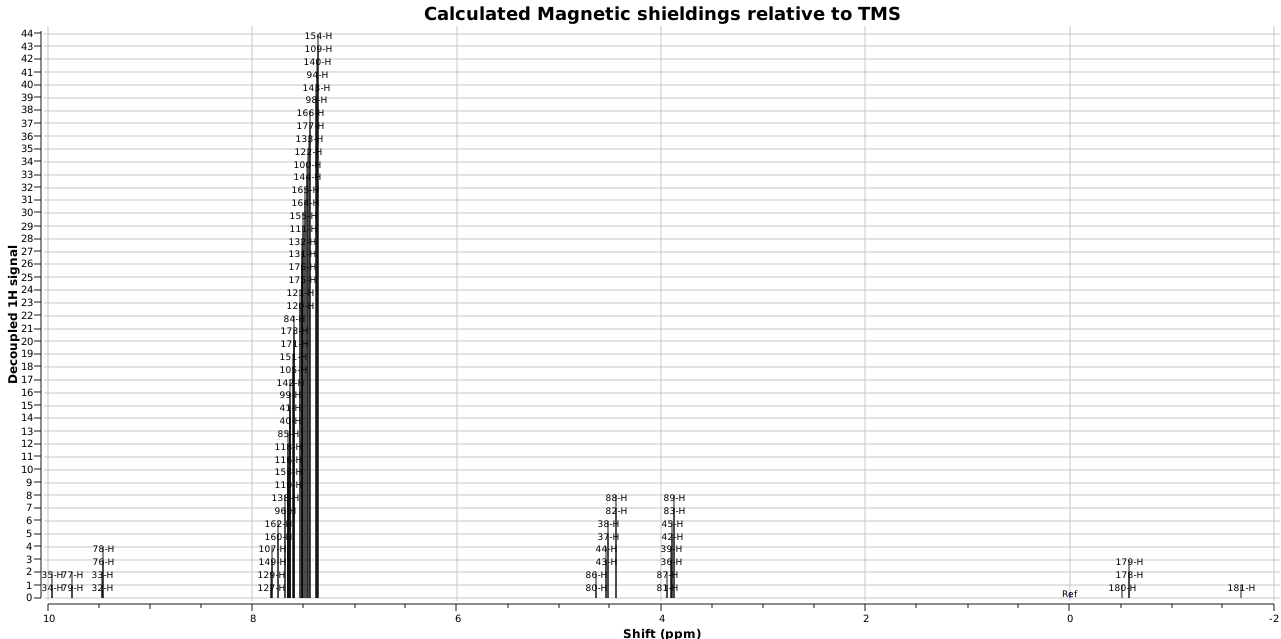
The above is a ωB97XD/6-311G(d,p)/SCRF=dichloromethane calculation (under optimum conditions, this can predict the shifts of protons to an accuracy of < 0.1 ppm!). So it is here, with the calculated methane chemical shift being -0.84 ppm (averaged over the four protons). In fact, the spectrum above is amazingly like the real thing (which can be seen at the DOI above), excepting of course proton couplings. Oh, if you cannot see a spectrum, it is because your browser does not support SVG. Why did I use this format? So that you can expand the view above (zoom in using your browser), and the SVG will rescale the drawing without loss of resolution!
We might presume then that the calculated structure must be a good model for the real thing (the structure of which Rebek and Co were never able to obtain). If you click on the model above, you may notice that the methane is not located exactly in the centre of the cavity, but it is displaced towards the face of one of the benzene rings, and away from the other. Thus these internal dolls do have a preference for where they sit, a phenomenon by the way which Rebek has termed social (molecular) isomerism (DOI: 10.1021/ja020607a).This system has 181 atoms. I estimate that this sort of calculation can readily be done for molecules with up to about 250 atoms nowadays, which would cover a fair sprinkling of these molecular Matryoshka dolls.
Postscript: Professor Rebek has kindly sent me the spectrum of both encapsulated methane and ethane which is reproduced below. The NMR of ethane calculated by the same procedure as above is -0.41 ppm.

The 1H NMR spectrum of encapsulated methane and ethane.
Archived on 2011-09-26. URL:http://www.ch.imperial.ac.uk/rzepa/blog/?p=4930. Accessed: 2011-09-26. (Archived by WebCite® at http://www.webcitation.org/61zSZeG7P)
Tags:General, Interesting chemistry
Posted in General, Interesting chemistry | No Comments »
Tuesday, August 2nd, 2011
In his famous lecture in 1959, C. P. Snow wrote about the breakdown in communications between the “two cultures” of modern society — the sciences and the humanities (arts). That was then. This is now, and the occasion of my visit to a spectacular “city of arts and sciences complex” in Europe. An un-missable exhibit representing science and life was the 15m high model of DNA. Now to be fair this is styled an artist’s impression, and one presumes that an artist is allowed license. But how much license? And at how much expense to the science? And is there a counterbalance to the art where the science is fastidiously (but artistically) preserved?

Let us start from the scientific end of this story, and try a mapping between the two representations. Below is a chemical diagram of one strand of the DNA duplex, showing two cytosines (the single 6-ring base) and two guanines (the 5+6 ring base) joined by a 5-ring ribofuranose to phosphates.

A scientific interpretation of DNA. Click for 3D model (of left handed duplex DNA!)
The artist has mapped the phosphates to the blue spheres and is clearly taking the license of not showing all the atoms (and in particular the other heteroatoms, such as O and N). That is schematic and designed not to overwhelm. I am more or less still happy (although the missing carbonyls are strange). Next, the phosphates are linked to the ribose. If you look carefully you might spot that the link is built to the centre of a C-C bond (I am starting to get slightly worried now). You can also clearly see that the links to the guanines are
via the 8-position of that ring, rather than the 9-position. Is this due to artistic license or the thought that it does not much matter? The pairs of bases, famously hydrogen bonded in a complementary manner, are now joined by a single “bond”, one end of which is now again attached at a bond mid-point. Little of the science of hydrogen bonding is preserved with this representation!
One more detail. These “rungs” joining the duplex have been rotated by 90° so that the planes of the bases are parallel to the helical axis, rather than perpendicular. How did the artist manage to construct his model in this orientation? Well, probably because he had been given a template similar to the (2D) structure diagram I showed above. A chemist would immediately “see” what is implicit in that diagram, which is all the C-H bonds. Chemists tend to miss these out, because they can be cluttered. But the hydrogen atoms are there, and they do occupy space. In the 3D model, they are still missing. If you imagine their positions in that model, you will immediately spot a number of locations where two hydrogen atoms are trying to occupy almost the same position in space! Of course, were you to rotate the sugar-base-base-sugar rungs by 90° this would create space for these invisible hydrogens.
So what about this breakdown in communication between the scientist and the artist? The latter has attempted two effects. One is to remove unnecessary detail so that one can directly go to the essentials. The other is to “move” the various components around so that they achieve greater “artistic effect”, but with a resulting substantial loss of scientific accuracy. I happen to believe that the model would have looked equally attractive if these scientific liberties had not been taken (perhaps even better!). Perhaps, as I suggest above, the artistic interpretation should be accompanied by a scientific one, to allow the visitor to the museum to see both? Or the communication between sculptor and scientist improved?
Well, I console myself with the observation that at least the artist represents a right rather than a left handed helix!
Tags:artist, chemical diagram, chemist, DNA duplex, duplex DNA, Europe, Historical, scientist and the artist, sculptor and scientist
Posted in General | 1 Comment »
Sunday, June 5th, 2011
In 1923, Coster and von Hevesey (DOI: 10.1038/111182a0) claimed discovery of the element Hafnium, atomic number 72 (latin Hafnia, meaning Copenhagen, where the authors worked) on the basis of six lines in its X-ray spectrum. The debate had long raged as to whether (undiscovered) element 72 belonged to the rare-earth group 3 of the periodic table below yttrium, or whether it should be placed in group 4 below zirconium. Establishing its chemical properties finally placed it in group 4. Why is this apparently arcane and obscure re-assignment historically significant? Because, in June 1922, in Göttingen, Niels Bohr had given a famous series of lectures now known as the Bohr Festspiele on the topic of his electron shell theory of the atom. Prior to giving these lectures he had submitted his collected thoughts in January 1922[1].
Like Mendeleev before, who had predicted ekasilicon, ekaaluminium and ekaboron (eventually discovered as germanium, gallium and scandium), Bohr had used his electron shell theory to (correctly) predict the properties of element 72. In modern terms, he had concluded that its electron shell structure must be 2.8.18.32.10.2 or [Xe].4f14.5d2.6s2. Classification as a rare earth would have resulted in the 4f shell having 15 electrons, impossible in Bohr’s theory. Coster and von Hevesey note in their article that Bohr’s striking prediction was now verified.
Why I am writing all of this? For various reasons:
- Unlike Mendeleev, Bohr’s prediction of the properties of a (then uncharacterized) element, whilst famous at the time, is nowadays largely forgotten by chemists. It is one of the great achievements of the then new quantum theory.
- Reading the 67 pages of Bohr’s article on the topic reveals no discussion of element 72 (articles of this era are nowadays only available as scanned images, not full text, and one must rely on a human visual scan of all 67 pages, which of course may not be reliable) but its (absence) in the table below is striking. Here VI means the 6th row of the periodic table.

Niels Bohr’s Periodic table, 1922.
- Notice the only other missing elements, Technetium (43), Promethium (61), Astatine (85), Francium (87) and Rhenium (75, the only non-radioactive one remaining to be discovered),
- I must presume that Bohr introduced his discussion of element 72 into his June lectures to make an impact with his audience! One might have hoped that tracking down what happened between January 1922, when Bohr fails to make much of the missing element 72, and June in the same year would be possible from Coster and von Hevesey’s citation of Bohr in 1923. But it was the practice of the time to rarely cite one’s sources. Thus they give no published citation to Bohr, and one might conclude that they might instead be quoting Bohr from his lectures rather than his writings (who, I wonder, was poor old Bury, now forgotten!).

Coster and Hevesey’s allusion to Bohr’s theory.
- Bohr’s own 1922 article on the topic is also visually striking. It contains in its 67 pages:
- 13 (short) equations
- Two figures (the second a variation on the first)
- One table (above).
- and lots of text (in German).
- No citations at the end, not even one, although many people are acknowledged in the text itself.
- No explicit statement of shell structures as e.g. 2.8.18.32.10.2 or [Xe].4f14.5d2.6s2.
Given that Bohr’s article can be regarded as one of the most influential of the 20th century (even prior to its being placed on a firm theoretical footing by solution of the Schroedinger equation for the hydrogen atom), I find it interesting how quickly it achieved this status (Bohr won the Nobel prize in 1922 as well). One might conclude that reputations were made as much via verbal presentations as by the immediate visual impact of the associated publications.
Finally, I note the striking contrast between Bohr’s article and Langmuir’s, written about a year earlier in 1921. Here, Langmuir sets out some postulates, the first of which is shown below.

Langmuir’s 1921 postulate.
The filled electron shells are clearly set out here (much more clearly than in Bohr’s 1922 article). But yet again, we remain baffled as to how Langmuir arrived at this postulate. Although he (very briefly) mentions Bohr in his own paper, it is only in the context of speculating about what prevents the electrons from falling into the nucleus, and few citations are again given (a notable exception is to Pease for suggesting the triple bond). We may only suspect that Langmuir had heard Bohr talking about his theory, and had extended G. N. Lewis’ concept (also not directly cited) of (filled) valence shells for his own theory of chemical bonding.
Well, in a little less than 90 years, we have progressed from finding almost no sources cited in some of the most influential papers of the 20th century, to the DOI (or URL) embedded in everything. I think that when the history of the present era is written, the introduction of the DOI/URL will take its place in the pantheon of great scientific events. Its the connections that matter, stupid!
Postscript. Hevesey in this review written in 1925 sets out a good history of Hafnium. This article contains (on p7) a clear statement of the electron shell structure of Hafnium as 2.8.18.32.8.2.2, which is cited as Bohr’s result. Hevesey quotes Bohr via reference 12, which is in fact to a book Bohr published in 1924. There is no mention of Langmuir in Hevesey’s review.
Postscript1: Hafnium (as its oxide) is now an essential element to the ever smaller fabrication of silicon chips (32nm and smaller). It is one of 14 elements considered essential to the future green technologies (six of which, but not including Hafnium, are considered in critical risk of supply disruption by 2015).
References
- N. Bohr, "Der Bau der Atome und die physikalischen und chemischen Eigenschaften der Elemente", Zeitschrift f�r Physik, vol. 9, pp. 1-67, 1922. https://doi.org/10.1007/bf01326955
Tags:Bohr, Bury, chemical bonding, chemical properties, Copenhagen, green technologies, Hafnium, Historical, Langmuir, Niels Bohr, silicon chips, Technetium, X-ray
Posted in Chemical IT, General | 5 Comments »
Thursday, June 2nd, 2011
The interface between physics, chemistry (and materials science) can be a fascinating one. Here I show a carbon nanotorus, devised by physicists[1] a few years ago. It is a theoretical species, and was predicted to have a colossal paramagnetic moment.

Carbon nanotorus. Click for 3D.
At 1364 carbon atoms, it is a little too big to calculate any of its expected chiroptical properties (the torus twists in a helical manner, and so is chiral). So we can only speculate whether e.g. its optical rotation would also be colossal! Or, what applications such a nanodevice might have. This post, by the way, was induced by seeing Steve Bachrach’s fascinating exploration of chiral nanohoops.
References
- L. Liu, G.Y. Guo, C.S. Jayanthi, and S.Y. Wu, "Colossal Paramagnetic Moments in Metallic Carbon Nanotori", Physical Review Letters, vol. 88, 2002. https://doi.org/10.1103/physrevlett.88.217206
Tags:chiroptical, metallic carbon, nanotorus, Steve Bachrach
Posted in General, Interesting chemistry | 6 Comments »
Friday, May 27th, 2011
Libraries (and librarians) are evolving rapidly. Thus a week or so ago one of our dynamic librarians here, approached some PhD students and academics to ask them how they used “Web 2.0” (thanks Jenny!). The result was edited (thanks John!) and uploaded, where you can see it below (embedded in this post, I might add, using HTML5). No doubt there is more of this genre to come. Libraries nowadays it seems, are not just about books and journals, but about the full digital experience (not to mention sustenance; ours is now one of the more popular places for students to eat!).
In another initiative, several of our research lectures will shortly be recorded, with slides, audio and video interleaved and the result expressed via our iTunesU site (in fact, I also tried a project along those lines in 1999, and the lectures are still visible here). Lecture podcasts are on the increase (inject directly into iTunes here to see/hear talks I gave on the topic of Wikipedia and iPads) and I have previously noted on this blog my thoughts about the future of (e)Books. A common theme of all this digital content is to maintain a balance between purely visual entertainment, whilst trying to also create re-usable and semantically-rich components. The movie above, informative as it might be, is largely meant to be entertaining (or engaging; I leave you to judge whether it succeeds in either endeavour). These blog posts (until this one), have concentrated more on the content than the style (although do note that I have been assiduous in running this blog with a mobile-device plugin so that it can be at least in part viewed in such a manner), delivering the former via Jmol models (and perhaps more of HTML5 in the future), with data-oriented information supplied via links to digital repositories.
I am struck by the ever increasing contrast between “chalk-n-talk” (the photo below pertains to my office blackboard, and as you can see I do still love my chalk, thanks Greg!) and the (probably bewildering) variety of additional digital outlets we now have. How on earth does one cope?

Office blackboard, with chalk!
Tags:Chalk, iPads, on-line tools, Twitter
Posted in Chemical IT, General | 1 Comment »
Wednesday, May 18th, 2011
In earlier posts, I alluded to what might make DNA wind into a left or a right-handed helix. Here I switch the magnification of our structural microscope up a notch to take a look at some more inner secrets.

A fragment of a single chain of DNA, taken from a Z-helix. Click for 3D.
The 3D coordinates of this fragment were obtained by taking a crystal structure of a Z-d(CGCG)2 containing oligomer, editing (to remove water, and superfluous bases) and subjecting it to ωB97XD/6-311G(d,p)/SCRF=water geometry refinement. This should be accurate enough to recover dispersion attractions, and various electronic and electrostatic interactions. Z-d(CGCG)2 was then reduced to the fragment you see above, which is large enough to capture the essence of the Z-helical wind, but small enough to be able to spot things which a larger fragment might overwhelm.
- The 3D model (click on above to obtain it) reveals that the oxygen of one of the five-membered (tetrahydrofuran) rings has a close contact to the guanine base of 2.85Å. This is some 0.3Å shorter than the combined van der Waals radii, and very typical of oxygen…electrophilic carbon interactions (see discussion here for more details). We can reasonably assume its real. It is supported by a small NBO perturbation term (~1.1 kcal/mol) corresponding to donation of the oxygen lone pair into a C-N π* orbital.
- The next interaction detected comes from a furanose C-H bond, in which the hydrogen approaches to within 2.48Å of the oxygen on the furanose the other side of the phosphate. This is ~0.14Å shorter than the combined van der Waals distances (remember, even at the actual vdW sum, the attraction is still attractive). Why would an apparently inert C-H bond do that? Such bonds are not normally considered in such analyses. Well, this one is special.
- It may well be (slightly) more acidic than normal due to a C-Hσ/C-Oσ* anti-periplanar interaction (E2 5.8, magenta bonds in 3D model) into the CH2-OH bond of the furanose. Hence the acidified H can form a weak(ish) hydrogen bond to the oxygen. The NBO E2 energy is 1.4 from the Olp to the C-H* bond (larger E2 interactions normally occur through bonds, but this one is through space, which is why it is smaller).
- These two interactions in turn set up a good orientation for the guanine to create a strong anomeric effect between it and the ribose; NLp/C-Oσ*; E2 11.6 (violet bond in 3D model, blue bond b in above diagram). To calibrate this interaction, anomeric effects in sugars are of the order of 14-16 kcal/mol. These stereoelectronic effect helps to slightly rigidify the relationship between the guanine base and the furanose it is connected to.
- In contrast, the cytosine-furanose link avoids the classical anomeric effect, and instead sets up a weaker one with a C-C bond instead (E2 6.8, indigo bond, blue bond a in above diagram). The Nlp is not as good a donor, because it is sequestered into the adjacent carbonyl group on the cytosine. The guanine has no such adjacent group, and so its Nlp is a better donor. The outcome of all of this is that the two bases, C and G end up having a different geometrical relationship to the furanose they are each connected to.
- Notice the gauche-like conformation of the ethane-1,2-diol fragment (gold bond in 3D model), which is again due to stereoelectronic alignments.
- Notice the Nlp …H-C distance of 2.51Å, which like 2 above, is around the sum of the vdW radii. It might be slightly more than just a dispersion attraction, since the NBO E2 Nlp/C-H* through space interaction is ~2 kcal/mol.
- There are some other relatively close atom-atom approaches, but I do not list them here. Do explore them yourself (they are labelled 8 in the diagram below).
To complete the present analysis, I include an ELF diagram. This can locate lone-pairs (as monosynaptic basins) as well as bond pairs (disynaptic basins) and so is useful for visualising the anti-periplanar anomeric effects between a lone pair and a bond (connecting a mono and a disynaptic basin if you like). Some of the interactions described in the list above are shown below with dotted lines (note that some of the lone pairs appear as two basins, distributed either face of the aromatic base).

ELF analysis. Click for 3D.
Well, cranking up the magnification on a microscope will always reveal new details. You might ask if these new details matter? Well, since DNA is such a very long polymer, repeating even a very weak (but predictable) interaction millions of times is bound to have some sort of cumulative effect. Who knows which of the ones above might play an important role in the super-winding of DNA, or its packing into a cell, or interaction with proteins, and so on. I do wonder how many of the terms I have identified above have been previously considered for such roles. Anyone know?
Postscript: Shown below is a non-covalent-analysis (NCI, see earlier post). A reminder that the interaction surface is colour coded with orange or red tinge if repulsive, blue if attractive, and green for weaker interactions. These surfaces pretty much recapitulate what it itemised above, adding also other interactions not listed above (labelled 8 in diagram).

NCI analysis for Z-CG fragment. Click for 3D.
Tags:adjacent, adjacent carbonyl, conformational analysis, energy, Julia Contreras-Garcia, N Lp, Postscript, Tutorial material, watoc11
Posted in General, Interesting chemistry | 3 Comments »
Friday, April 29th, 2011
At a recent conference, I talked about what books might look like in the near future, with the focus on mobile devices such as the iPad. I ended by asserting that it is a very exciting time to be an aspiring book author, with one’s hands on (what matters), the content. Ways of expressing that content are currently undergoing an explosion of new metaphors, and we might even expect some of them to succeed! But content is king, as they say.
Here I list only some innovative solutions which have emerged in the last year or so, but which also raise important issues which we ignore at our peril.
- TouchPress were one of the first publishers to get off the mark with their living books. Their first offering was The Elements, deriving from an earlier interactive display of the periodic table (an example of which can be seen in the entrance to the chemistry building at Imperial College). It is a programmed book, in the sense that the content is expressed using code written by the publisher (very much in the manner of interactive games).
- Next to appear were Inkling, who describe their offering as interactive. Their approach is described in a blog written by their founder, Matt Macinnis. There he talks about The Art of Content Engineering, which again makes it sound as if authoring a book is in effect programming it! (I know what he means; if you follow the link to the talk I allude to above, you may spot that it too is, at least in part, programmed, and not simply written). Inkling also promote the book as part of a social network, with readers able to annotate the content, and share that annotation with others.
- The latest company to change the way books are both read and authored is Pushpoppress, the heart of which is also an interactive app.
- Then there is the epub3 format. This is a free and open standard for e-books. This third revision in particular is meant to enhance interactivity.
Something of a common theme so far. Books are going to be interactive! But what about these issues?
- Each of the first three (commercial) publishers above has adopted their own programming format. Although HTML5 may be at the heart of some of this, programming may also mean control (in the sense that the creative industries must put control of their content at the heart of what they do). Each of the first three above sound like a closed system, and extracting re-usable content is, I argue, an essential part of doing science. I am just a tad worried that the approaches exemplified above may not allow this to happen.
- Suppose you manage to acquire a chemistry textbook in any of the four approaches listed above. Will they inter-operate, in the sense of being able to extract data from one and perhaps inject it into another? Or will each be a data- or information silo, rigidly controlled by the creative content generator (whoever that is)?
- What might an aspiring author, intent on creating interactive content do? Should they go closed/proprietary or open? They will clearly need to retrain themselves. We have indeed come a long way along the road: hand-written manuscript → typed manuscript → word-processed manuscript → interactive app! Like computer games, is the day of the single-authored book rapidly fading, to be replaced by a large team, each with their own tasks to perform?
I end with this question. Is the era of books, just like the Web itself, going to be the app? And who will be able to (find the time) to participate?
Tags:aspiring author, aspiring book author, e-books, Imperial College, intent on creating interactive content do, iPad, King, Matt Macinnis, mobile devices, social network, Tutorial material
Posted in Chemical IT, General | 8 Comments »
Thursday, February 24th, 2011
One of my chemical heroes is William Perkin, who in 1856 famously (and accidentally) made the dye mauveine as an 18 year old whilst a student of August von Hofmann, the founder of the Royal College of Chemistry (at what is now Imperial College London). Perkin went on to found the British synthetic dyestuffs and perfumeries industries. The photo below shows Charles Rees, who was for many years the Hofmann professor of organic chemistry at the very same institute as Perkin and Hofmann himself, wearing his mauveine tie. A colleague, who is about to give a talk on mauveine, asked if I knew why it was, well so very mauve. It is a tad bright for today’s tastes!

Charles Rees, wearing a bow tie dyed with (Perkin original) mauveine and holding a journal named after Perkin.
The first thing to note about mauveine is that it is not a single compound; actual samples can contain up to 13 different forms! These all vary in the number of methyl groups present which range from none up to four, in various positions. These compounds all have absorption maxima λmax in the range 540-550nm, the colour of purple. The structure of one of these, known as mauveine A, is shown below.

Mauveine A. Click to load 3D
You can see from this that something is missing. The so-called chromophore is a cation, and an anion needs to be provided to balance the charge. We will now attempt to predict the color of purple using purely the power of quantum mechanics (for many years, accurate prediction of colour was a holy grail amongst dye chemists for obvious reasons). The anion can be chloride, and the colour is often measured in methanol as solvent. So the first task is to calculate this ion-pair. This used to be easier said than done (and in the past, the anion was often simply neglected). But using the ωB97XD density functional procedure (to get the van der Waals interactions modelled correctly) and a 6-311++G(d,p) basis set, coupled with a smoothed-cavity continuum solvation procedure, and two molecules of water (standing in for methanol, which is a bit bigger) as explicit solvent molecules, we get the structure apparent when you click on the diagram above (DOI:
10042/to-7320). Application of time-dependent density function theory (TD-DFT) gives a measure of the
UV-optical spectrum (below, loaded as a scaleable SVG image. If you are using a modern browser, it should display. If not, try the latest FireFox, Chrome, Safari etc).
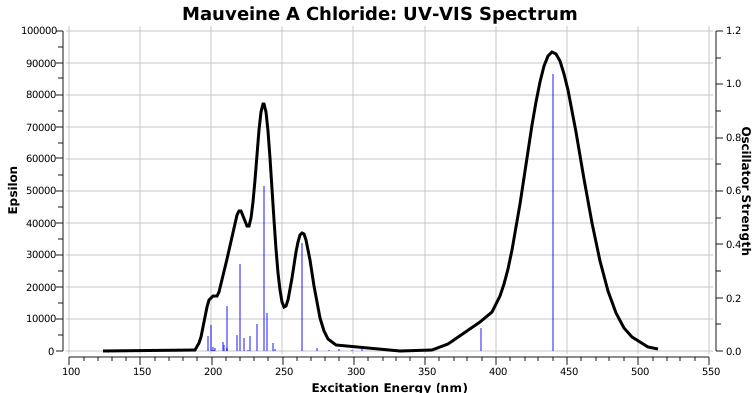
This has several noteworthy aspects.
- The visible (right hand side) part of the spectrum is very monochromatic, with λmax ~440nm. In other words, mauveine has a pure and intense colour.
- This λmax is hardly affected by the presence of the counterion.
- The electronic transition responsible for this band is a simple HOMO (highest-occupied-molecular-orbital) to LUMO (lowest-unoccupied-molecular-orbital) excitation of an electron.
- These orbitals are shown below.
| LUMO |
HOMO |
 Mauveine A. LUMO. Click for 3D |
 Mauveine A. HOMO. Click for 3D |
- Note how the excitation involves the central region of the molecule, and one of the pendant aryl groups, but not the other. One might presume that tuning the colour would only work if changes are made to the first of these aryl groups.
- There is a real mystery about the calculated value of λmax, which differs from the observed value by about 100nm (the wrong colour, making mauveine orange rather than purple). Normally, this sort of time dependent density functional theory has errors no greater than 15-20nm. The calculated value of λmax is not sensitive to the basis set, or the presence or not of the counter ion and solvent. Clearly, a discrepancy of this magnitude must have some other explanation. Watch this space!
So this post ends with a bit of a mystery. The fanciest most modern computational theory gets the colour of mauveine wrong by ~100nm. Why?
Tags:August von Hofmann, Charles Rees, chemical heroes, chiroptical, colour, founder, Historical, Hofmann, HOMO, Imperial College, Imperial College London, LUMO, Mauveine, Perkin, professor of organic chemistry, purple, Rees, Royal College of Chemistry, William Perkin
Posted in General, Interesting chemistry | 16 Comments »
Sunday, February 13th, 2011
The Möbius band is an experimental delight. In its original forms, it came flat-packed as below. The one shown on the left is related to the international symbol for recycling (if we denote the number of half twists imparted as m, this one has m=3). The middle one (m=4) shows a 4-twisted variant, and the one on the right has a 5-twist (m=5). These all come from Möbius’ original sketches, found amongst his belongings when he died. In this post they will form the basis for some experiments in molecular chirality.

Flat-packed Möbius bands
These Möbius bands are all chiral, which means they cannot be superimposed upon their mirror image. We may in fact give the two forms labels, M and P (similar to the left and right handed helical forms for DNA noted in a previous post). Armed with a selection of these rings, I list below some experiments in paper cutting that you could try. I will use the notation Mm or Pm to denote the handedness and twistedness of each strip and + to denote glueing.
- Build two strips, each m=1 and glue them together orthogonally, then cut down the middle of each strip with a pair of scissors. The process is already illustrated with lots of nice photos (using pink-coloured strips) on this blog and the outcome below is transcluded here from the original post. If the strips are flat-packed first, then they will fit into an envelope, and all that would be needed for the recipient to complete the valentine is the preceding instructions (plus some glue and scissors)!

- My purpose here is to take this basic experiment and to suggest variations, using the following variables; the chirality M or P, the number of twists m in each, and the total number of strips used N. As is noted in the original instructions, a valentine is only produced if one M1 and one P1 strip is so joined (N=2), what chemists would call a heterochiral pair. What happens when a homochiral pair is used instead? The chemical term is that we end up with diastereomers, in other words M1+P1 and M1+M1 have a diastereomeric relationship, and P1+P1 and M1+M1 would have an enantiomeric relationship (as of course do M and P themselves).
- One repeats experiments 1 and 2 using heterocoloured strips rather than the same colour as above. How are the two colours distributed?
- Experiments 1-3 are then repeated for M2 and P2
- Experiment 4 is then repeated for M3 and P3
- One can now move on to N>2. For N=3, one might construct a isotactic polymer P1+P1+P1 or a heterotactic polymer P1+M1+P1.
- The cutting down the centre of each strip does not have direct chemical analogy you might think, but in fact if you relate the cut to the node in a p-atomic orbital, one can quickly move into Möbius conjugation and aromaticity. One might ask whether any of the preceding experiments might relate to the molecular trefoil I described in another post? Or these lemniscular octaphyrins?
- There are other variations. Thus N=2 dimers constructed with dissimilar twists as P1+P3 or perhaps even P1+M2. I will not try to list all the permutations.
- If your head is not yet swimming, consider a tetramer N=4, but now complete a second supercycle by joining the first band to the fourth.
- And as a final flourish, is it possible to give the supercycle described in experiment 9 a twist before you join the ends together? Would it matter if that twist were M or P? Would it matter if N were even or odd? The chemical analogy here of course is to cyclic (and supercoiled) RNA molecules, which are increasingly implicated in the transition from pre-biotic to post-biotic chemistry.
I have to confess I have not tried the majority of the above experiments myself! If anyone does and gets anything interesting, do tell. What I hope I have illustrated here is how these simple experiments in twisting, gluing and cutting simple strips of paper may actually tell us something about molecules and their polymers and perhaps life itself.
Tags:chemical analogy, chemical term, Möbius, pre-biotic, RNA, Tutorial material, Valentine
Posted in General | 1 Comment »
Saturday, February 5th, 2011
In 1953, the model of the DNA molecule led to what has become regarded as the most famous scientific diagram of the 20th century. It had all started 93 years earlier in 1860, at a time when the tetravalency of carbon was only just established (by William Odling) and the concept of atoms as real entities was to remain controversial for another 45 years (for example Faraday, perhaps the most famous scientist alive in 1860 did not believe atoms were real). So the idea of constructing a molecular model from atoms as the basis for understanding chemical behaviour was perhaps bolder than we might think. It is shown below, part of a set built for August Wilhelm von Hofmann as part of the lectures he delivered at the Royal College of Chemistry in London (now Imperial College).

The original August Wilhelm von Hofmann molecular model
This grand-daddy of all molecular models does have some interesting features. The most obvious is that the carbon atom at the centre is square planar (tetrahedral carbon was still 14 years in the future). What HAS survived to the present day is the colour scheme used (black=carbon, white=hydrogen, and not shown here, red=oxygen, blue=nitrogen, green=chlorine). But another noteworthy aspect is the relative size of the white hydrogen, which is larger than the black carbon. This deficiency was however very soon rectified in 1861 by Josef Loschmidt, who published a famous pamphlet in which he set out his ideas for the structures of more than 270 molecules (many of which by the way were cyclic, and this some four years before Kekule’s dream!). An example (#239) is shown below, which gets the relative sizes of the atoms more or less correct (OK, chlorine is shown with rather an odd shape). To get an idea of how good Loschmidt’s model actually was, click on the diagram to load a modern model, and compare the two! Even more impressive, these diagrams pre-date van der Waals work on the finite sizes of atoms, first presented in 1873.

Loschmidt’s molecular models. Click for 3D
To conclude, I cannot resist showing one more model. Hermann Sachse believed cyclohexane could not be planar. To try to convince people, in 1890 he included a “flat-packed” model in the pages of a journal article, evidently believing that people would cut it out, and assemble it into a 3D shape.

Flat-packed molecular model of cyclohexane
You might have noticed a theme in the present blog of presenting 3D models for many of the molecules I discuss (include the Loschmidt one above). For the historians amongst you, I note our 1995 article in which we updated[1] Sachse’s origami with an article featuring how to incorporate interactive models into journals (still sadly only too rare). Perhaps a history of the molecular model, and how it has been presented over 150 years might be an interesting one to trace!
References
- O. Casher, G.K. Chandramohan, M.J. Hargreaves, C. Leach, P. Murray-Rust, H.S. Rzepa, R. Sayle, and B.J. Whitaker, "Hyperactive molecules and the World-Wide-Web information system", Journal of the Chemical Society, Perkin Transactions 2, pp. 7, 1995. https://doi.org/10.1039/p29950000007
Tags:and compare the two, chemical behaviour, deficiency, Hermann Sachse, Historical, Hofmann, Imperial College, Josef Loschmidt, Loschmidt, model, modern model, molecular model, Odling, Royal College of Chemistry, Royal College of Chemistry in London, Sachse, scientist, Tutorial material, Wilhelm von Hofmann, William Odling
Posted in General | 3 Comments »


